Build a Microsoft Edge-ready dashboard page with a customizable template
Choose the best dashboard page template for Microsoft Edge
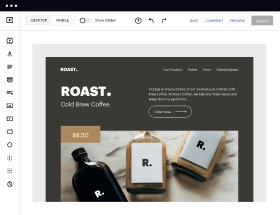
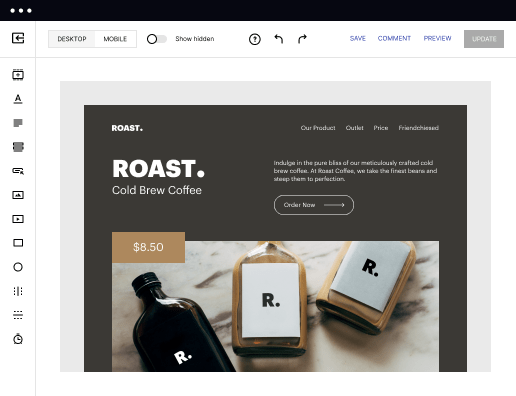
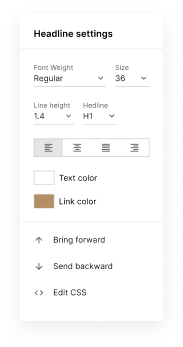
Easy to build without coding
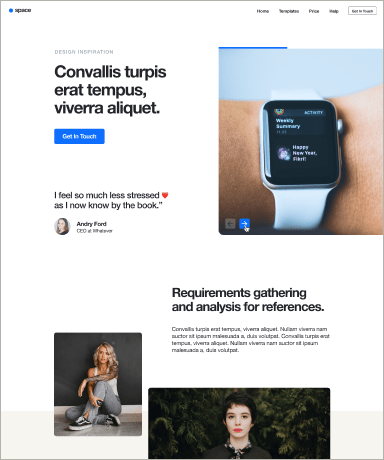
With the intuitive drag-and-drop builder, anyone on your team can create high-converting pages without any knowledge of code or design. Make enhancements to your landing page with custom widgets using Javascript, HTML/CSS, or third-party scripts.
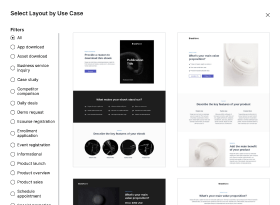
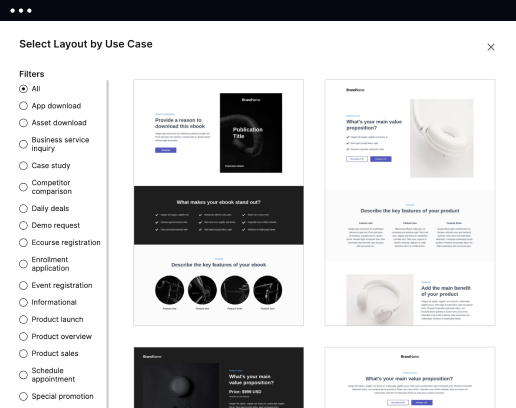
Multiple layouts for any industry and goal
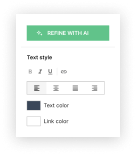
Select from 500+ landing page layouts built to boost conversions across industry-specific scenarios. Customize them by adjusting fonts, adding images, and generating on-brand content with the AI assistant. Quickly scale with Instablocks® and Global Blocks that you can save, reuse, and update globally.
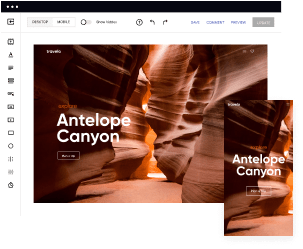
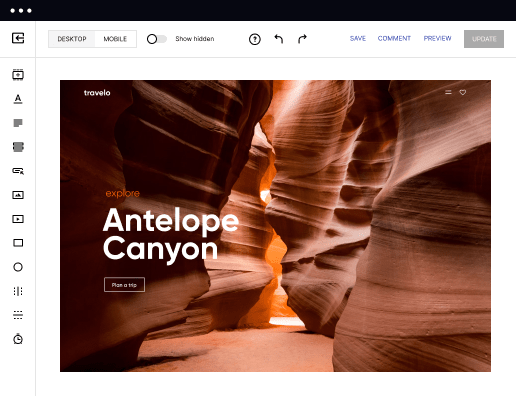
Loads fast and looks polished on any device
Every template is responsive, which means they present professionally on any device and load blazingly fast with our Thor Render Engine. You can also power them up with Google AMP technology to deliver an unparalleled mobile experience and drive higher conversions.
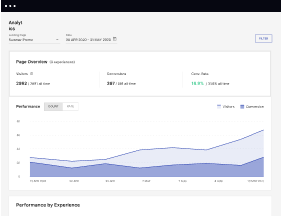
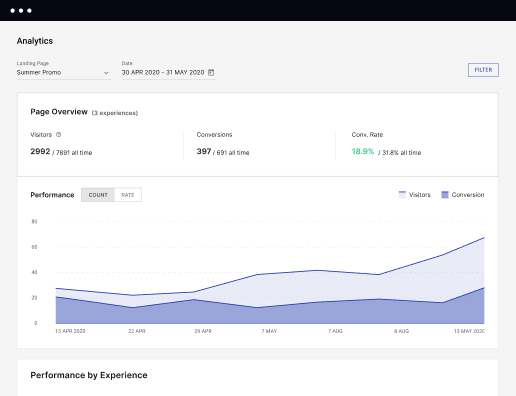
Robust analytics & experimentation
Get real-time updates and reporting across all your devices, showing the number of visitors, conversions, cost-per-visitor, and cost-per-lead. Launch AI-powered experiments, run A/B tests, and use heatmaps to analyze user behavior, then optimize your landing page to maximize conversions.

Easy to build without coding
With the intuitive drag-and-drop builder, anyone on your team can create high-converting pages without any knowledge of code or design. Make enhancements to your landing page with custom widgets using Javascript, HTML/CSS, or third-party scripts.
Multiple layouts for any industry and goal
Select from 500+ landing page layouts built to boost conversions across industry-specific scenarios. Customize them by adjusting fonts, adding images, and generating on-brand content with the AI assistant. Quickly scale with Instablocks® and Global Blocks that you can save, reuse, and update globally.
Loads fast and looks polished on any device
Every template is responsive, which means they present professionally on any device and load blazingly fast with our Thor Render Engine. You can also power them up with Google AMP technology to deliver an unparalleled mobile experience and drive higher conversions.
Robust analytics & experimentation
Get real-time updates and reporting across all your devices, showing the number of visitors, conversions, cost-per-visitor, and cost-per-lead. Launch AI-powered experiments, run A/B tests, and use heatmaps to analyze user behavior, then optimize your landing page to maximize conversions.
All the features you need to build lead-generating landing pages

Landing page builder
Easily create landing pages with the intuitive drag-and-drop page builder that features contextual element editing, over 500 page layouts, and 33 million images.

Visual on-page collaboration
Invite teammates and clients to collaborate on page design in real time to get your pages created, reviewed, and launched faster.

AI content generation
Instantly generate audience-focused content with AI-crafted headlines, paragraphs, and CTAs directly within the Instapage builder.

500+ customizable layouts
Choose from a range of professionally tailored page layouts, specifically designed to enhance conversion rates across numerous industry-specific scenarios.
Instablocks
Quickly build personalized landing pages using individual page blocks that you can customize, save, and reuse.
Thor Render Engine
Our back-end technology ensures that your landing pages load quickly to increase conversions, SEO rankings, and enhance the overall user experience.
AMP
Use Google AMP framework to build and A/B test mobile-responsive pages that load fast and drive more conversions.
Analytics
Seamlessly connect to Google Analytics to get real-time updates on cost-per-visitor and cost-per-lead metrics directly in the Instapage platform.
Learn how to build top-performing landing pages for any goal
FAQs
“Instapage gives us the ability to tailor our landing page content and layout to tell a unique story for each geographical target. The platform also enables us to create different variations with content that performs well for each unique channel. Every marketing team needs this!”

"Instapage has truly maximized our digital advertising performance by enabling us to offer matching, personalized experiences for every ad and audience. Now we can scale our landing page experiences as efficiently and effectively as we scale the ads themselves."

"If we have to wait on a developer, our creative velocity plummets. But Instapage has made it possible for us to exponentially grow our advertising programs and convert more customers"

Leading the way in building high-performing landing pages


Maximize your ROI with the ultimate Instapage landing page creation platform
Creating engaging and effective landing pages is crucial in today's digital marketing landscape, especially for marketers in sectors such as business services, tech, and education. Instapage streamlines the landing page creation process with powerful tools designed to accelerate your marketing campaigns and optimize conversion rates effortlessly. With over 100 templates and built-in optimization features, it's tailored to meet the unique needs of diverse industries.
Why choose Instapage for landing page optimization?
Instapage stands apart from other platforms due to its comprehensive offerings that empower marketers to maximize their advertising efforts. Key reasons to choose Instapage include:
- User-friendly page builder: Create stunning landing pages without technical skills using drag-and-drop functionality.
- Robust analytics tools: Gain insights into user behavior with detailed heatmaps and analytics, enabling data-driven decisions.
- Collaboration ease: Improve teamwork with real-time feedback and secure sharing options, ensuring all stakeholders are aligned.
Step 1: Utilizing templates for quick launches
The first step in optimizing your landing page is to leverage Instapage's extensive library of templates. Choose a template that aligns with your campaign goals and customize it to reflect your brand's voice. Consider these tips:
- Select conversion-optimized templates that emphasize calls to action.
- Utilize pre-built lead generation elements to collect important visitor data.
- Make use of dynamic text replacement to personalize headers and improve relevance.
Step 2: Implementing optimization strategies
After creating your landing page, it's crucial to focus on optimization. Use A/B testing to compare variations of your page and determine what resonates best with your audience. Here are the optimization strategies to consider:
- Integrate custom analytics to measure performance metrics relevant to your objectives.
- Utilize heatmaps to analyze where users interact the most with your page.
- Iterate based on feedback and data insights to enhance user experience continually.
Step 3: Personalizing the user experience
Lastly, personalizing your content for different audience segments can significantly increase engagement. Use Instapage's personalization tools to deliver tailored experiences. Here’s how:
- Dynamically adjust page content based on user demographics and behavior.
- Align specific ads with relevant landing pages using AdMaps.
- Monitor audience-level metrics for continuous improvement.
By following these steps, you can effectively capitalize on the capabilities of Instapage, ultimately maximizing your marketing return on investment.
Ready to take your digital marketing strategy to the next level? Start your trial with Instapage today and transform how you approach landing pages!
People also ask about Dashboard page template optimized for Microsoft Edge
Exploring the dynamics of a dashboard page template optimized for Microsoft Edge
Unveiling the dashboard: A central hub for data management
A dashboard serves as a visual interface that aggregates and displays data from various sources. In the context of web analytics, it synthesizes complex data into clear, understandable views, providing users with key insights for decision-making.
The primary purpose of dashboards is to facilitate performance monitoring and streamline workflow. By consolidating metrics and KPIs in one location, users can quickly assess performance and make informed decisions. This is particularly vital for teams working in fast-paced environments, where timely data is critical.
Microsoft Edge offers unique features such as enhanced security, speed, and accessibility that readers should consider. The importance of optimization lies in ensuring that users experience seamless functionality while accessing dashboard information from various devices and scenarios.
Core components of an effective dashboard
An optimized dashboard template should incorporate several key features to enhance accessibility and usability. One major principle is responsive design, which ensures that the layout adjusts gracefully across different screen sizes, crucial for Microsoft Edge users who may be accessing data on varied devices.
User interface (UI) and user experience (UX) considerations are equally important. A clean layout that avoids clutter encourages users to interact with the dashboard more freely. Tooltips, modals, and contextual help can significantly boost user engagement and comprehension.
Responsive layouts that adapt to different screen sizes.
Intuitive navigation that minimizes user effort.
Visual consistency across different dashboard elements.
Understanding your metrics: A deep dive into KPIs
Key Performance Indicators (KPIs) are instrumental in tracking business objectives. Within our dashboard template context, defining and selecting relevant KPIs is critical for providing actionable insights and ensuring that the dashboard effectively serves its audience.
KPI relevance varies extensively based on the industry and business goals. For instance, e-commerce sites will focus on conversion rates, while service-oriented businesses may prioritize customer satisfaction metrics. Connecting these KPIs to business outcomes is essential for illustrating the dashboard's value.
Conversion rates to measure sales effectiveness.
Click-through rates for marketing performance assessment.
Churn rates to identify customer retention issues.
Leveraging data sources for enhanced insights
To maximize dashboard effectiveness, integrating multiple reliable data sources is fundamental. This could involve collecting data from platforms such as Google Analytics, CRM software, or social media insights to create a holistic picture of business performance.
Real-time data collection is another critical aspect. The ability to see up-to-date metrics not only enhances decision-making but also enables rapid response to emerging trends, optimizing overall performance.
Utilization of APIs for seamless data integration.
Importance of automated updates to eliminate manual errors.
Consolidating various data points for detailed analysis.
Real-world applications: Dashboard examples
The use of dashboards spans across various industries, showcasing their versatility. For instance, a Hospital Emergency Response Dashboard can track key metrics that directly impact response times, ensuring patients receive timely care.
Similarly, Marketing Analytics Dashboards enable teams to assess the effectiveness of digital campaigns by visualizing consumer interaction. Through visual representations like conversion funnels, marketing professionals can identify traffic sources and optimize their strategies.
Hospital Emergency Response Dashboard for critical time tracking.
Marketing Analytics Dashboard showcasing digital campaign successes.
Financial Dashboards used for real-time market performance analysis.
Understanding the role of MMR in dashboard performance
Market Mix Modeling (MMR) offers another layer of insight for businesses measuring the impact of various marketing efforts using dashboard metrics. By integrating MMR, businesses can assess the effectiveness of different channels, tailoring strategies for optimal resource allocation.
Incorporating MMR calculations within dashboard templates allows users to visualize the data comprehensively. By doing so, metrics can highlight the direct relationship between marketing spend and revenue, leading to more informed decision-making.
Integrating MMR for comprehensive channel performance insights.
Example visual metrics showing real-time marketing effectiveness.
Leveraging MMR for strategic planning on budget allocation.
Continuous improvement: Updating pages and metrics
Dashboards that remain static can quickly become outdated, leading to poor decision-making. Regular updates are necessary to reflect the most current data, ensuring that users have access to timely and relevant information. This is especially crucial in fast-moving industries where market conditions can change rapidly.
In order to keep dashboards functioning optimally, techniques such as automated data refresh and regular review cycles should be implemented. This will not only keep the dashboard current but also maintain strong user engagement.
Implementing automated updates to showcase real-time performance.
Creating feedback loops to gather user insights.
Regularly reviewing metrics to align with business objectives.
Monitoring success through web analytics
An effective web analytics dashboard should encompass various essential components that deliver a comprehensive view of website performance. Key components include traffic sources, user engagement, and conversion metrics, forming a foundation for data-driven decisions.
Integrating SEO metrics is crucial for understanding how content drives organic traffic. These insights can inform content strategies, enabling marketers to target their audience more effectively and drive higher engagement rates.
Traffic sources to evaluate the effectiveness of different channels.
User engagement metrics for assessing content interaction.
Conversion rates as benchmarks for success measurement.
Future trends in dashboard design and optimization
The landscape of dashboard design is continually advancing. Future trends indicate an increased focus on user experience, integrating features that allow for customization according to user preferences. Innovations in data visualization techniques will also improve user interaction, encouraging more dynamic engagements with data.
Artificial intelligence is poised to play a significant role as predictive analytics becomes a focal point in dashboard functionality. This will equip users with tools to forecast trends and make proactive decisions based on real-time patterns.
User-friendly designs that prioritize personalization.
Artificial intelligence integration to enhance data analysis.
Predictive analytics features for more informed decision-making.
Best practices for creating your dashboard template
Creating an effective dashboard template for Microsoft Edge requires careful consideration of several vital elements to ensure performance and usability. A checklist can be instrumental in guiding designers through the essential features and best practices.
Key strategies also involve maintaining clarity amidst data presentation. It’s easy to overwhelm users with excessive information; therefore, utilizing visual hierarchies and clear labeling can significantly enhance comprehension.
Ensure responsive design for all device displays.
Maintain a clean, uncluttered layout to foster engagement.
Include features for interactivity to boost user experience.
Ready to skyrocket conversions?
Supercharge your ad campaigns with high-performing landing pages
Get started