Bootstrap optimized statistics page template
Explore Similar TemplatesAbout template
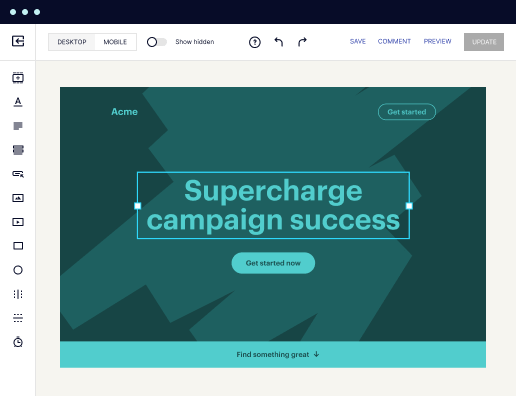
Supercharge your statistics page with Bootstrap for outstanding performance! Learn more today.
Recommended templates


Easy to build without coding
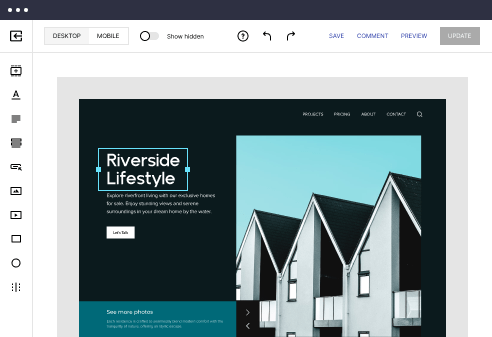
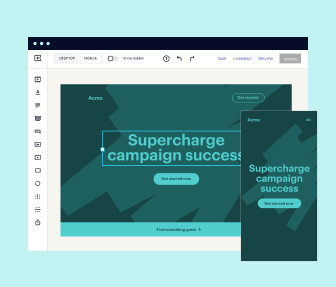
With the intuitive drag-and-drop builder, anyone on your team can create high-converting pages without any knowledge of code or design. Make enhancements to your landing page with custom widgets using Javascript, HTML/CSS, or third-party scripts.
Multiple layouts for any industry and goal
Select from 500+ landing page layouts built to boost conversions across industry-specific scenarios. Customize them by adjusting fonts, adding images, and generating on-brand content with the AI assistant. Quickly scale with Instablocks® and Global Blocks that you can save, reuse, and update globally.
Loads fast and looks polished on any device
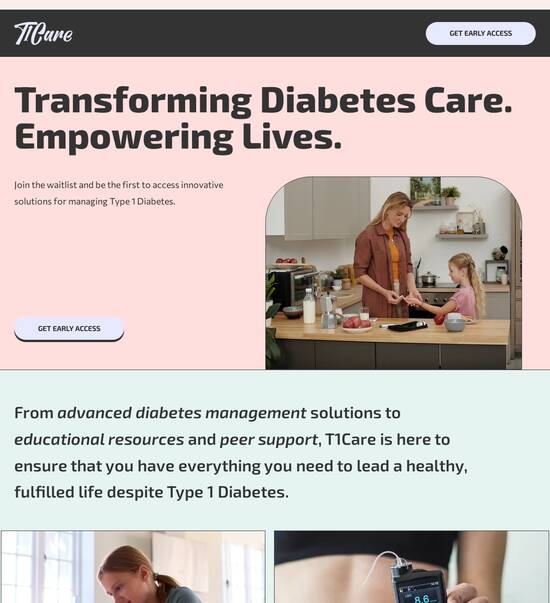
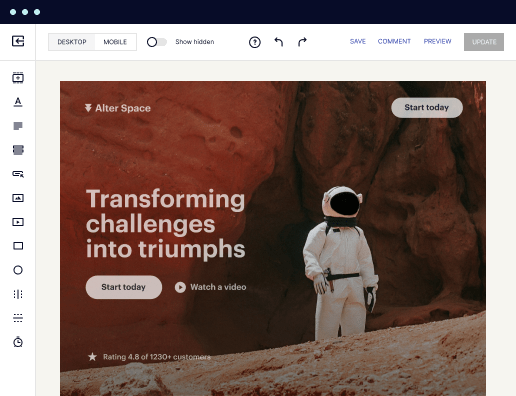
Every template is responsive, which means they present professionally on any device and load blazingly fast with our Thor Render Engine. You can also power them up with Google AMP technology to deliver an unparalleled mobile experience and drive higher conversions.

Robust analytics & experimentation
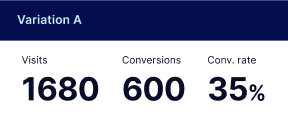
Get real-time updates and reporting across all your devices, showing the number of visitors, conversions, cost-per-visitor, and cost-per-lead. Launch AI-powered experiments, run A/B tests, and use heatmaps to analyze user behavior, then optimize your landing page to maximize conversions.


Easy to build without coding
With the intuitive drag-and-drop builder, anyone on your team can create high-converting pages without any knowledge of code or design. Make enhancements to your landing page with custom widgets using Javascript, HTML/CSS, or third-party scripts.
Multiple layouts for any industry and goal
Select from 500+ landing page layouts built to boost conversions across industry-specific scenarios. Customize them by adjusting fonts, adding images, and generating on-brand content with the AI assistant. Quickly scale with Instablocks® and Global Blocks that you can save, reuse, and update globally.
Loads fast and looks polished on any device
Every template is responsive, which means they present professionally on any device and load blazingly fast with our Thor Render Engine.
Robust analytics & experimentation
Get real-time updates and reporting across all your devices, showing the number of visitors, conversions, cost-per-visitor, and cost-per-lead. Launch AI-powered experiments, run A/B tests, and use heatmaps to analyze user behavior, then optimize your landing page to maximize conversions.
All the features you need to build lead-generating landing pages

Landing page builder
Easily create landing pages with the intuitive drag-and-drop page builder that features contextual element editing, over 500 page layouts, and 33 million images.

Visual on-page collaboration
Invite teammates and clients to collaborate on page design in real time to get your pages created, reviewed, and launched faster.

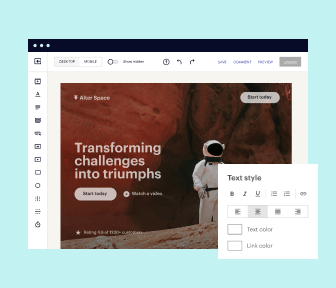
AI content generation
Instantly generate audience-focused content with AI-crafted headlines, paragraphs, and CTAs directly within the Instapage builder.

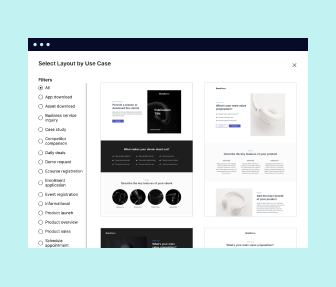
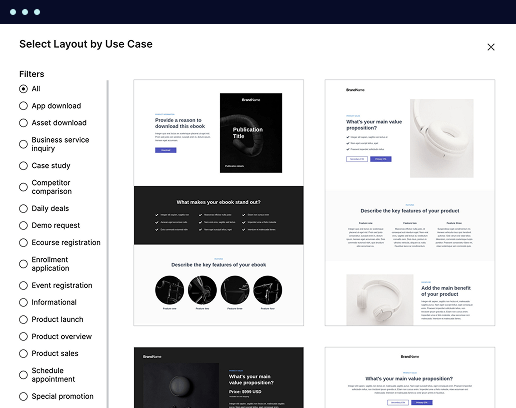
500+ customizable layouts
Choose from a range of professionally tailored page layouts, specifically designed to enhance conversion rates across numerous industry-specific scenarios.
Instablocks
Quickly build personalized landing pages using individual page blocks that you can customize, save, and reuse.
Thor Render Engine
Our back-end technology ensures that your landing pages load quickly to increase conversions, SEO rankings, and enhance the overall user experience.
Analytics
Seamlessly connect to Google Analytics to get real-time updates on cost-per-visitor and cost-per-lead metrics directly in the Instapage platform.
Learn how to build top-performing landing pages for any goal
FAQs
“Instapage gives us the ability to tailor our landing page content and layout to tell a unique story for each geographical target. The platform also enables us to create different variations with content that performs well for each unique channel. Every marketing team needs this!”

"Instapage has truly maximized our digital advertising performance by enabling us to offer matching, personalized experiences for every ad and audience. Now we can scale our landing page experiences as efficiently and effectively as we scale the ads themselves."

"If we have to wait on a developer, our creative velocity plummets. But Instapage has made it possible for us to exponentially grow our advertising programs and convert more customers"

Leading the way in building high-performing landing pages


An effective step-by-step guide for the instapage landing page optimization
Creating a high-converting landing page is essential for increasing the return on investment (ROI) of your digital marketing campaigns. The instapage platform equips marketers with a powerful suite of tools to accelerate, optimize, and scale their efforts. This guide will provide detailed steps to leverage the platform effectively for superior campaign outcomes.
Understand your audience
Before diving into page creation, it's crucial to know who your target audience is. For departments focused on business services, marketing, tech, education, and more, tailoring your message to their specific needs can significantly enhance engagement and conversion rates. Use demographic data, industry insights, and customer feedback to create an audience persona.
- Implement demographic analysis to identify key characteristics of your audience.
- Gather insights from customer interactions to understand their pain points.
- Utilize feedback loops to refine audience personas continually.
Choose the right template
Once you understand your audience, the next step is to select from instapage's extensive library of over 100 high-converting templates. These templates are designed to meet various objectives and can be customized to resonate with your specific audience.
- Consider the goal of your campaign when selecting a template.
- Choose layouts that align with your brand for consistency.
- Utilize conversion-focused designs, utilizing lead generation elements effectively.
Optimize for conversions
Optimization is key in maximizing landing page effectiveness. Use built-in experimentation features, A/B testing, and analytics provided by instapage to evaluate performance. By analyzing heatmaps and conversion paths, you can identify areas needing improvement.
- Conduct A/B tests on headlines, calls to action, and images.
- Use analytics dashboards to track engagement metrics.
- Leverage heatmaps to visually assess user interaction on your pages.
Taking the time to analyze and optimize your landing pages will lead to higher conversion rates and improved campaign ROI.
For more insights on maximizing your marketing campaigns, explore instapage's support resources and community forums.
Transform your marketing strategies today with instapage, and see how our tools can elevate your online performance.
Bootstrap optimized statistics page template: a comprehensive guide
Understanding Bootstrap optimized statistics page templates
Bootstrap is a popular front-end framework that facilitates the development of responsive and visually appealing websites quickly. By providing pre-designed components and a grid system, it allows developers to create layouts that are both functional and aesthetically pleasing. In the context of statistics page templates, Bootstrap offers a structured way to present data while ensuring usability across different devices.
Statistics pages play a crucial role in web design by displaying data insights effectively. These pages help organizations communicate performance, track progress, and make informed decisions based on quantifiable metrics. A Bootstrap optimized statistics page template streamlines this process, allowing developers to focus on content rather than design details.
Key features of Bootstrap statistics templates
Responsiveness: Ensures seamless adaption across devices such as desktop, tablet, and mobile.
Customizability: Offers tools to tailor designs that meet specific user needs.
Integration capabilities: Supports syncing with various data sources for real-time updates.
The advantages of utilizing a Bootstrap statistics template
Using a Bootstrap statistics template enhances user experience significantly. The intuitive layout guides users to find information easily, ensuring they can engage with data efficiently. Furthermore, by employing modern design practices, these templates make statistical displays visually appealing, helping to maintain user interest.
Additionally, the development process is streamlined with pre-built components that reduce the effort required in coding. Developers can manipulate HTML structures without having to write extensive code from scratch, which minimizes coding errors and boosts overall performance. This efficiency aligns with modern organizational goals of saving time and resources.
Enhanced user experience through clear layout and navigation.
Pre-built components streamline the development process.
Real-time data presentation aids informed decision-making.
Features that make Bootstrap statistics templates stand out
One of the standout features of Bootstrap statistics templates is the integration of interactive charts and data visualizations. These templates support a wide range of chart types, including bar, line, and pie charts, facilitating effective data representation tailored to user preferences. Engaging visualizations can enhance user interaction, making data exploration a dynamic experience.
Moreover, Bootstrap’s flexible layout options play a vital role in content presentation. Its grid system allows developers to arrange information logically, transforming how users perceive data. Custom widgets can be incorporated to display statistics in various formats, ensuring the layout meets different audiences' expectations.
Support for various interactive chart types enhances user engagement.
Flexible layout options optimize content presentation.
Cross-device compatibility ensures accessibility for all users.
Crafting an effective statistics page
Structuring content for clarity and engagement is essential when crafting a statistics page. A logical flow that transitions from raw data to insightful interpretations can keep users engaged. Using subtitles, bullet points, and numbered lists can further enhance readability, allowing users to absorb information effortlessly.
Incorporating visual elements like images and infographics greatly aids in enhancing understanding. The careful selection of visuals complements statistics effectively, making complex data more digestible. Highlighting key data and outcomes is another effective strategy, ensuring critical figures and findings stand out amidst the overall presentation.
Use a logical content flow to maintain user engagement.
Incorporate visuals like infographics to improve understanding.
Emphasize critical data to guide user perceptions.
Use cases: real-world applications of Bootstrap statistics templates
Bootstrap statistics templates are versatile and can be applied in various industry contexts. For corporate organizations, enhancing board presentations through well-designed data displays can drive strategic discussions. Educational institutions benefit by visualizing academic statistics, providing stakeholders with insights into performance trends and areas needing attention.
In the e-commerce sector, showcasing sales and user engagement metrics helps businesses stay competitive. Customizing templates for different audience segments allows organizations to cater to distinct user needs, enhancing overall engagement. Gathering user feedback can further refine presentation styles, ensuring the data conveys the desired message effectively.
Corporate reports enhance board presentations with compelling data.
Educational institutions visualize statistics for stakeholder insights.
E-commerce uses metrics to display sales and engagement efficiently.
Technical aspects of Bootstrap statistics templates
Understanding the technical aspects underlying Bootstrap statistics templates is crucial for effective implementation. Maintaining semantic HTML ensures that the content is both accessible and optimized for search engines. Clean, maintainable code not only eases future upgrades but also contributes to a more efficient overall design process.
Leveraging JavaScript libraries like Chart.js or D3.js can enhance the functionality of statistics pages, allowing for dynamic data displays that adjust to user interactions. Integrating these libraries with Bootstrap templates offers limitless possibilities for visual storytelling, ensuring that relevant information is presented in engaging ways.
Use semantic HTML for better accessibility and SEO.
Integrate JavaScript libraries for dynamic data presentation.
Optimize performance through clean coding practices.
The future of statistics pages in web design
As web design continues to evolve, statistics pages must adapt to emerging trends and technologies. Expectations for design standards are shifting toward minimalism and efficiency, with a focus on seamless user experiences. Artificial intelligence is likely to play a significant role in data analysis and presentation, personalizing user experiences in innovative ways.
Simultaneously, users are demanding increasingly real-time data and analytics to make informed decisions. Intuitive design and user interfaces will become paramount in ensuring that statistics pages cater to these expectations, promoting clarity in data representation and fostering user engagement.
Predicted design standards favor minimalism and efficiency.
AI integration enhances data analysis and personalization.
User expectations shift toward real-time data availability.
Examples of effective Bootstrap statistics templates
Looking at real-world applications can shed light on the effectiveness of Bootstrap statistics templates. Various organizations have successfully implemented these templates, enhancing their data presentation and communication. Case studies often reveal specific design choices and emphasize how certain metrics drive stakeholder engagement and decision-making.
Moreover, analyzing popular template providers helps identify standout features and functionalities. By comparing offerings based on user feedback and customizability, potential users can gain insights into which templates may best suit their organizational needs and align with their objectives.
Study case examples showcasing successful template implementations.
Evaluate template providers for features and functionalities.
Review user feedback to determine the best fit for unique needs.
Crafting your own Bootstrap statistics template
Building a customized Bootstrap statistics template involves several important steps. First, setting up the framework and creating the initial code structure lays the foundation for your project. Developers should pay close attention to responsive design principles to ensure seamless functionality across device types while considering user experience.
Once the framework is established, testing and iterating on the design is crucial for making informed improvements. Techniques such as A/B testing can help determine which layouts are more effective for user engagement. Additionally, gathering analytics data will provide valuable insights, guiding future template refinements and enhancements.
Set up your framework with responsive design principles.
Conduct A/B testing for layout effectiveness.
Analyze user feedback to enhance your template.
Ready to skyrocket conversions?
Supercharge your ad campaigns with high-performing landing pages
Get started