Make your tailored splash page for Reporting analysts
Empower Reporting analysts with Instapage to deliver impactful splash page experiences and boost conversions.
Make your splash page for reporting analysts with Instapage
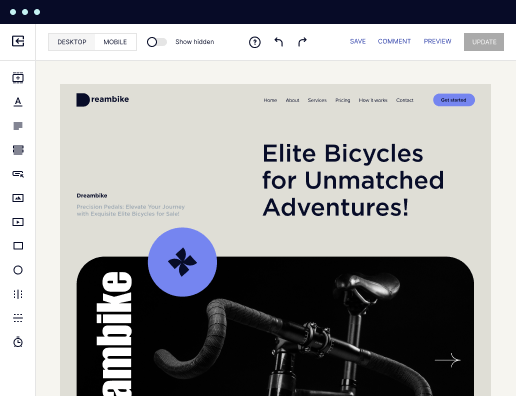
Creating a compelling splash page designed specifically for reporting analysts is crucial for effectively communicating key data insights and strategic analysis. Instapage offers a powerful landing page creation platform that empowers marketers to build these pages swiftly and without the need for coding skills. With over 100 conversion-focused layouts and customizable Instablocks, Instapage ensures that your splash page is tailored to resonate with your target audience.
Understanding the key elements for your splash page
To make your splash page for reporting analysts effective, it’s important to consider several essential components. These include clarity of messaging, relevant visuals, and actionable insights tailored to the audience's needs.
- Clear messaging: Clearly define the key data insights you want to present. This helps to align the expectations of your audience, whether they are business service professionals, financial analysts, or educators.
- Engaging visuals: Use charts and graphs to visually depict data trends, making complex information more digestible.
- Strong calls to action (CTA): Encourage your audience to explore further reporting tools or contact your team directly.
Step 1: Selecting the right template
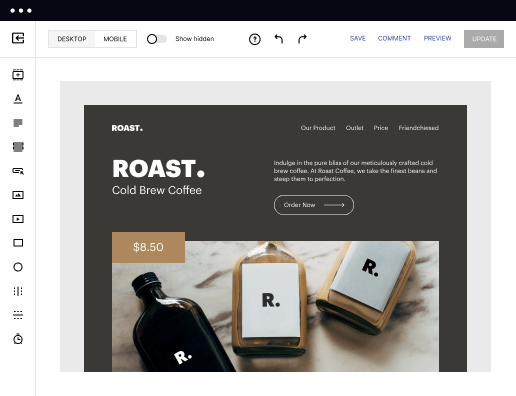
Begin by choosing a robust template that suits reporting analytics. Instapage's library offers a myriad of customizable templates that can facilitate rapid designs without compromising on quality. Think about your audience’s preferences and industry standards while making your selection.
- Conversion-focused designs: Opt for layouts that prioritize user engagement and lead generation.
- Visual hierarchy: Ensure that the most important information stands out, making it easier for users to grasp the content quickly.
- Mobile responsiveness: Choose templates that are optimized for all devices, ensuring your page looks great on desktops and mobile devices alike.
Step 2: Optimizing with built-in experimentation tools
After selecting a template, utilize Instapage’s built-in optimization tools to improve your page’s performance. Through A/B testing and heatmaps, you can analyze how visitors interact with the page, allowing you to refine layouts, headlines, and calls to action.
- A/B testing: Experiment with different versions of your splash page to identify which designs convert better.
- Heatmap analysis: Understand where users click and focus their attention on your page, using this data to enhance user experience.
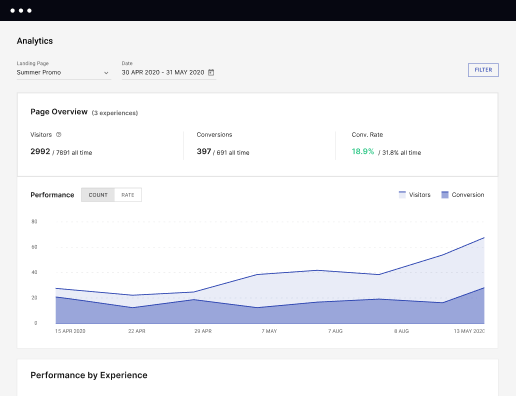
- Analytics dashboard: Monitor performance over time, adjusting content and strategies based on real user behavior.
Step 3: Personalizing content for different audiences
One of the standout features of Instapage is dynamic content personalization. By using tools like dynamic text replacement, you can tailor the content based on specific criteria such as visitor demographics or previous interactions, which fosters a deeper connection with your audience.
In conclusion, making your splash page for reporting analysts is not just about delivering data—it's about creating an engaging experience that is tailored to the needs of your audience. With Instapage, you can optimize this process efficiently.
Ready to create your tailored splash page for reporting analysts? Start using Instapage today and witness how quickly you can transform your landing page approach.
Get more out of Make your splash page for Reporting analysts
Improve your Quality Score with quick load technology for landing pages
Increase conversions with content that aligns with your ads and audiences
Achieve maximum ROI by scaling your marketing initiatives
Leading the way in building high-performing landing pages


FAQs
See how to make your splash page for reporting analysts in action
Ready to skyrocket conversions?
Supercharge your ad campaigns with high-performing landing pages.
Get started
