Make your statistics page optimized for iPad
Instapage empowers you to slash costs, skyrocket conversions, and deliver tailored experiences on iPad.

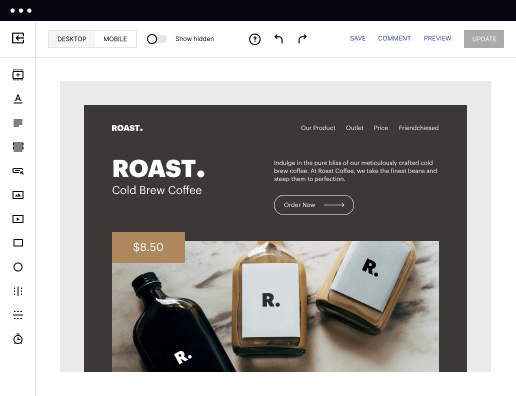
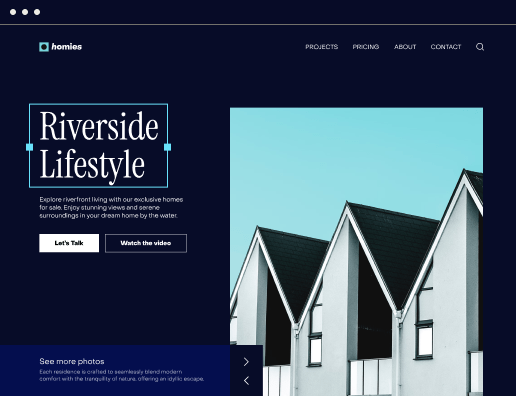
 500+ customizable layouts
Get your campaigns up and running faster with conversion-focused landing page layouts designed for every industry and business type. Easily scale landing page generation with Instablocks® and Global Blocks that you can save, reuse, and update globally.

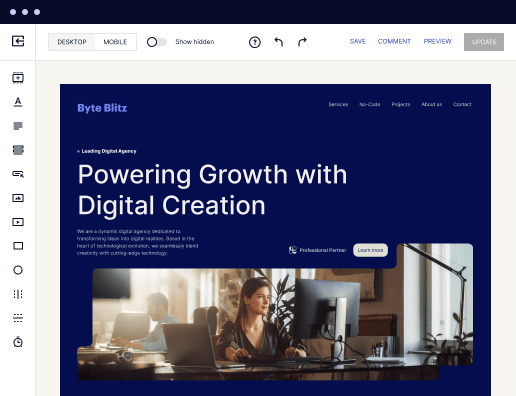
 Mobile responsiveness
All Instapage landing pages are optimized for responsiveness. They adapt to any screen size, ensuring a consistent user experience across all devices.

 A/B split testing
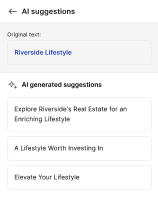
Make data-driven decisions to optimize conversions with A/B testing capabilities. Experiment with different landing page variations, separate elements, layouts, and content that you can instantly generate with AI.

 Seamless ad mapping
Boost conversions and lower your CPA by personalizing your landing pages. With AdMap®, you can effortlessly visualize your ad campaigns, link them to relevant landing pages, or create new personalized pages. Then, synchronize updates of ads and landing pages without any back-and-forth.

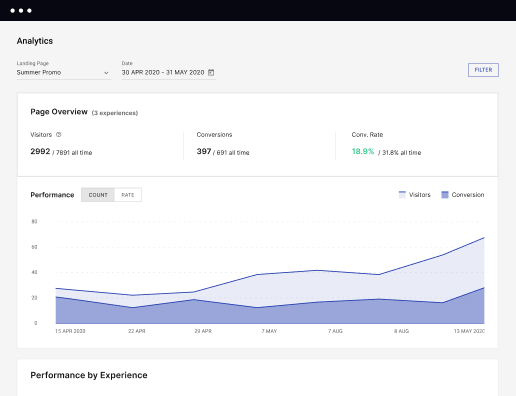
 Detailed reporting
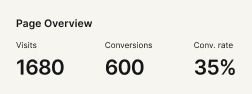
Instapage provides detailed real-time reports over any period of time and across all your devices. To help you better understand your audience and optimize your marketing strategy, check conversion analytics that you can view directly from Instapage.

 Integrations with 120+ marketing tools
Instapage seamlessly connects with popular marketing tools and platforms, including CRMs, e-commerce, analytics tools, marketing automation platforms, email marketing software, and more. Everything you need to drive conversions and grow your business is at your fingertips.


Build your statistics page on iPad: A Step-by-Step Guide
Creating a statistics page tailored for your audience is a game-changer in today's digital landscape. Instapage provides a unique opportunity to build your statistics page on iPad quickly and effectively, ensuring you can showcase data that enhances your brand’s credibility. By syncing design flexibility with optimal performance, you can reduce costs while increasing conversions, catering specifically to the needs of marketers across various industries.
Understanding the Essentials of Your Statistics Page
Before diving into the creation process, it’s crucial to understand the essentials that make a statistics page compelling. This section covers the core elements that enhance user engagement and improve conversion rates.
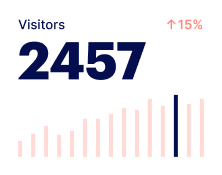
- Clear and concise data presentation: Utilize graphs and charts that clearly communicate the statistics without overwhelming the viewer.
- Mobile-optimized design: Ensure the page is visual-friendly on iPad, adjusting layouts for small screens without sacrificing quality.
- Audience-specific content: Tailor the data to resonate with your specific market segments, leveraging Instapage's personalization features.
Step 1: Using Instapage Templates
Getting started with Instapage is simple. Choose from over 100 conversion-focused templates that align with your branding and data presentation needs. This first step facilitates a smooth process towards creating your statistics page on iPad.
- Select a template that fits your branding: Ensure colors and fonts match your business identity.
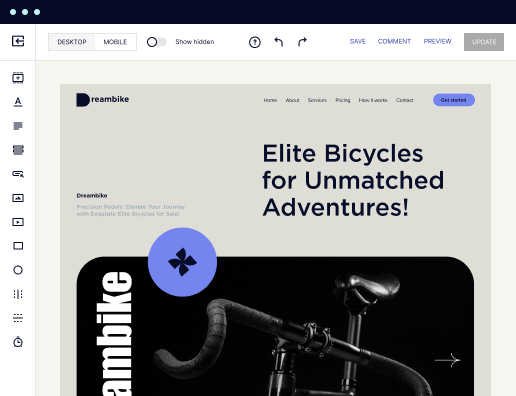
- Customize the template: Use the drag-and-drop functionality to add charts, images, and text blocks effortlessly.
- Preview changes: Utilize the real-time preview feature to ensure the page looks great on all devices, particularly iPads.
Step 2: Optimizing for Conversions
With the structure in place, it's time to optimize your statistics page for maximum performance. This involves utilizing built-in experimentation tools, essential for making data-driven decisions.
- Conduct A/B testing: Experiment with different headlines or layouts to see what leads to better engagement.
- Analyze heatmaps: Utilize detailed heatmaps to identify where visitors click the most and refine those sections accordingly.
- Implement a robust analytics strategy: Use the analytics dashboard to track performance indicators like conversion rates and bounce rates.
Step 3: Personalization and Collaboration
The final stage focuses on delivering personalized experiences while efficiently collaborating with your team or stakeholders. Instapage enables instant feedback and real-time edits.
- Use dynamic text replacement: Tailor content for specific demographics to make it relatable and impactful.
- AdMaps for alignment: Pair ads with the corresponding landing page for a seamless user experience.
- Share for collaboration: Use secure sharing options to get feedback from team members or clients, accelerating the review process.
In conclusion, building a statistics page on iPad using Instapage not only simplifies the design process but also elevates your marketing strategy. The combination of flexibility, optimization, and personalization guarantees you can connect with your audience effectively.
Start creating your statistics page on iPad today with Instapage and watch how your conversion rates soar. Sign up now to explore all the capabilities at your fingertips!
Get more out of Build your statistics page on iPad
Improve your Quality Score with quick load technology for landing pages
Increase conversions with content that aligns with your ads and audiences
Achieve maximum ROI by scaling your marketing initiatives
“Instapage gives us the ability to tailor our landing page content and layout to tell a unique story for each geographical target. The platform also enables us to create different variations with content that performs well for each unique channel. Every marketing team needs this!”

"Instapage has truly maximized our digital advertising performance by enabling us to offer matching, personalized experiences for every ad and audience. Now we can scale our landing page experiences as efficiently and effectively as we scale the ads themselves."

"If we have to wait on a developer, our creative velocity plummets. But Instapage has made it possible for us to exponentially grow our advertising programs and convert more customers"

Leading the way in building high-performing landing pages


FAQs
See how to build your statistics page on ipad in action
Ready to skyrocket conversions?
Supercharge your ad campaigns with high-performing landing pages.
Get started