React.js optimized statistics page template
Explore Similar TemplatesAbout template
Supercharge your statistics page with React.js for outstanding performance! Learn more today.
Recommended templates


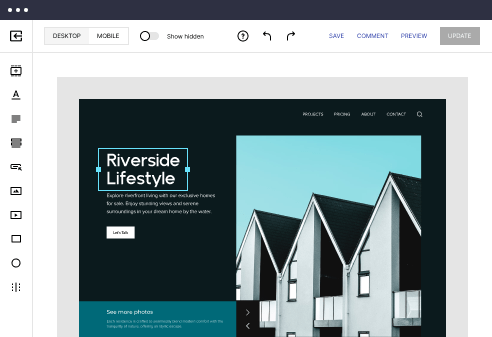
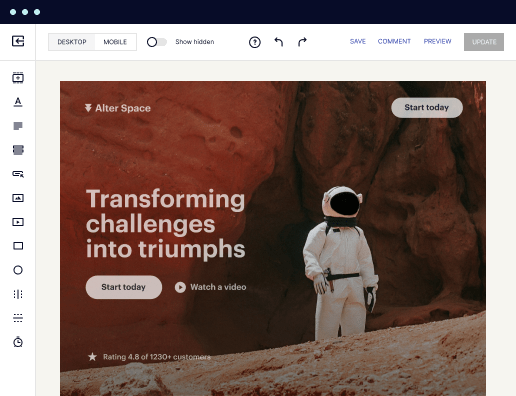
Easy to build without coding
With the intuitive drag-and-drop builder, anyone on your team can create high-converting pages without any knowledge of code or design. Make enhancements to your landing page with custom widgets using Javascript, HTML/CSS, or third-party scripts.
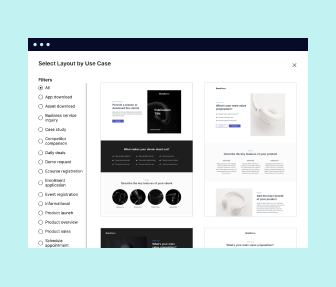
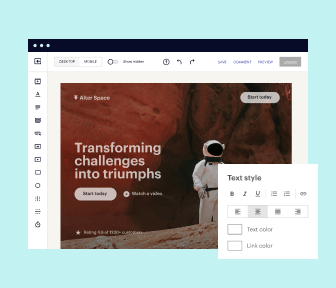
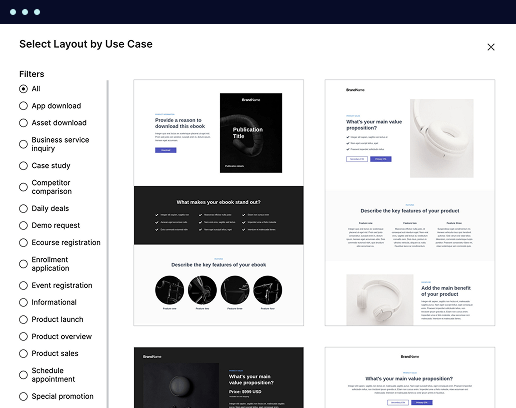
Multiple layouts for any industry and goal
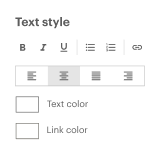
Select from 500+ landing page layouts built to boost conversions across industry-specific scenarios. Customize them by adjusting fonts, adding images, and generating on-brand content with the AI assistant. Quickly scale with Instablocks® and Global Blocks that you can save, reuse, and update globally.
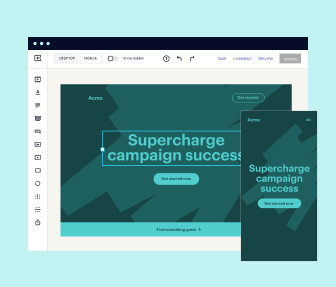
Loads fast and looks polished on any device
Every template is responsive, which means they present professionally on any device and load blazingly fast with our Thor Render Engine. You can also power them up with Google AMP technology to deliver an unparalleled mobile experience and drive higher conversions.
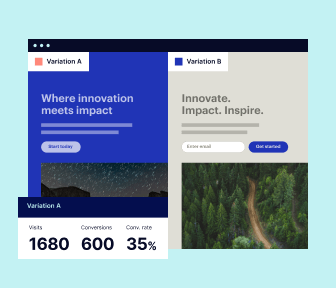
Robust analytics & experimentation
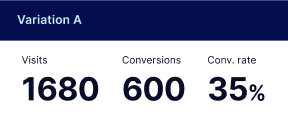
Get real-time updates and reporting across all your devices, showing the number of visitors, conversions, cost-per-visitor, and cost-per-lead. Launch AI-powered experiments, run A/B tests, and use heatmaps to analyze user behavior, then optimize your landing page to maximize conversions.


Easy to build without coding
With the intuitive drag-and-drop builder, anyone on your team can create high-converting pages without any knowledge of code or design. Make enhancements to your landing page with custom widgets using Javascript, HTML/CSS, or third-party scripts.
Multiple layouts for any industry and goal
Select from 500+ landing page layouts built to boost conversions across industry-specific scenarios. Customize them by adjusting fonts, adding images, and generating on-brand content with the AI assistant. Quickly scale with Instablocks® and Global Blocks that you can save, reuse, and update globally.
Loads fast and looks polished on any device
Every template is responsive, which means they present professionally on any device and load blazingly fast with our Thor Render Engine.
Robust analytics & experimentation
Get real-time updates and reporting across all your devices, showing the number of visitors, conversions, cost-per-visitor, and cost-per-lead. Launch AI-powered experiments, run A/B tests, and use heatmaps to analyze user behavior, then optimize your landing page to maximize conversions.
All the features you need to build lead-generating landing pages

Landing page builder
Easily create landing pages with the intuitive drag-and-drop page builder that features contextual element editing, over 500 page layouts, and 33 million images.

Visual on-page collaboration
Invite teammates and clients to collaborate on page design in real time to get your pages created, reviewed, and launched faster.

AI content generation
Instantly generate audience-focused content with AI-crafted headlines, paragraphs, and CTAs directly within the Instapage builder.

500+ customizable layouts
Choose from a range of professionally tailored page layouts, specifically designed to enhance conversion rates across numerous industry-specific scenarios.
Instablocks
Quickly build personalized landing pages using individual page blocks that you can customize, save, and reuse.
Thor Render Engine
Our back-end technology ensures that your landing pages load quickly to increase conversions, SEO rankings, and enhance the overall user experience.
Analytics
Seamlessly connect to Google Analytics to get real-time updates on cost-per-visitor and cost-per-lead metrics directly in the Instapage platform.
Learn how to build top-performing landing pages for any goal
FAQs
“Instapage gives us the ability to tailor our landing page content and layout to tell a unique story for each geographical target. The platform also enables us to create different variations with content that performs well for each unique channel. Every marketing team needs this!”

"Instapage has truly maximized our digital advertising performance by enabling us to offer matching, personalized experiences for every ad and audience. Now we can scale our landing page experiences as efficiently and effectively as we scale the ads themselves."

"If we have to wait on a developer, our creative velocity plummets. But Instapage has made it possible for us to exponentially grow our advertising programs and convert more customers"

Leading the way in building high-performing landing pages


A step-by-step guide to leveraging Instapage for your marketing campaigns
Harnessing the power of Instapage can significantly transform your digital marketing campaigns. By utilizing this leading landing page and conversion rate optimization (CRO) platform, businesses across sectors such as Marketing and Advertising, Financial Services, and Education can accelerate their online presence. This guide provides a comprehensive roadmap to making the most of Instapage for your marketing needs.
Step 1: Create eye-catching landing pages
The first step in utilizing Instapage effectively is to build landing pages that capture attention and convert visitors. With over 100 high-converting, ready-to-use templates and an intuitive page builder, marketers can create visually appealing pages without any coding knowledge. Here's how to get started:
- Choose a template: Select a template that aligns with your campaign goals, ensuring it resonates with your target audience.
- Customize your design: Utilize Instablocks to modify elements like text, images, and forms to reflect your brand’s identity.
- Preview and publish: Always preview your landing page on different devices before publishing to ensure a seamless user experience.
Step 2: Optimize for conversions
Once your landing page is live, the next crucial phase is optimization. Instapage provides built-in experimentation features to enhance performance. Use these to adjust and refine your pages over time.
- Utilize A/B testing: Regularly test different versions of your landing page to determine what resonates best with your audience.
- Analyze with heatmaps: Leverage detailed heatmaps to see where users click most frequently, allowing you to adjust your design and layout effectively.
- Monitor analytics: Utilize the comprehensive analytics dashboard to keep track of key metrics like conversion rate and average time on page.
Step 3: Personalize experiences
Creating personalized user experiences through Instapage can dramatically increase engagement and conversion rates. The platform allows for dynamic text replacement and audience-specific content delivery.
- Dynamically adapt content: Tailor text and offers on landing pages to match the ad that brought the visitor, enhancing relevance.
- Implement AdMaps: This feature allows marketers to automatically align specific ads with dedicated landing pages, streamlining user experience.
- Track audience metrics: Use advanced data tracking tools to monitor how different audience segments interact with your landing pages.
Through these steps, marketers can fully utilize the capabilities of Instapage to drive higher conversions and ROI from their digital marketing campaigns.
By following this guide, you'll be well on your way to mastering landing page creation and optimization. Instapage's tools streamline your workflow and empower your marketing strategies, no matter your team's size or budget.
Start leveraging the power of Instapage today to transform how you engage your audiences and maximize the success of your digital marketing efforts!
ReactJS optimized statistics page template: A comprehensive guide
Understanding the essence of a statistics page template in ReactJS
The statistics page template serves as a vital component in applications that deal with data interpretation and decision-making. Its primary purpose is to provide users with a clear and actionable insight into the information at hand. In the digital landscape, where data-driven decisions are paramount, having a well-structured statistics page can enhance user experience and improve overall business productivity.
ReactJS plays an essential role in developing these templates due to its ability to create highly interactive user interfaces. The framework’s component-based architecture allows developers to build reusable UI components that can significantly reduce development time while enhancing application performance. This efficiency is crucial when managing complex data visualizations, which are often a hallmark of effective statistics pages.
Importance of statistics in data-driven decision-making
The role of ReactJS in creating dynamic and efficient UI
Core features of a ReactJS optimized statistics page template
An effective statistics page template is built around a flexible structure that accommodates a variety of datasets and visual representations. The folder structure should be well-organized, promoting efficient collaboration and easy integration of new features. This involves configuring files for data handling, preprocessing, and maintaining a clear separation of concerns for easier management.
Another key feature is route management, which is made seamless through React Router. This enables developers to design multiple routes for different statistics or datasets without losing the overall application context. Efficient route management enhances user experience by providing smooth transitions between data visualizations.
Overview of folder structures
Configuration for data handling and preprocessing
Technologies powering your statistics page
ReactJS is the backbone of an optimized statistics page template, leveraging its component-based architecture. This allows for reusability of components, making it easier to maintain and update visual elements throughout the application. With hooks, developers can manage state dynamically and handle lifecycle events in functional components, further optimizing performance.
In terms of data visualization, various charting libraries such as Chart.js, D3.js, and Recharts can be integrated with React. Each library has its unique attributes; for instance, Chart.js is celebrated for its simplicity, while D3.js offers profound control over visual elements. Choosing the right library hinges on project requirements and developer familiarity.
Component-based architecture for reusability
Hooks – managing state and lifecycle in functional components
Collaborative development and community support
Engagement with open-source collectives plays an instrumental role in the development of robust statistics templates. By tapping into the community’s collective knowledge, developers can access a wealth of resources, libraries, and templates that can offer significant enhancements to their projects. Popular GitHub repositories serve as an excellent foundation for inspiration and collaboration.
Building a development team with a diverse skillset is essential. A successful team may include front-end developers proficient in React, back-end developers who handle server interactions, and UI/UX designers focused on creating appealing interfaces. Utilizing collaborative tools like Trello and Slack can streamline project management and communication among team members.
Importance of community in developing robust templates
Popular GitHub repositories for inspiration
Strategic content development for your statistics page
User-centric content development is crucial for ensuring that users can effectively interpret data presented on statistics pages. Developing narratives that guide user interpretation can significantly improve user engagement. This involves understanding the audience's journey and crafting content that resonates with their needs.
Addressing common user inquiries directly on the statistics page can contribute to better user satisfaction. By organizing information based on frequent questions, developers can enhance accessibility and content relevance, ensuring users find the answers they seek swiftly.
Developing narratives that guide user interpretation of data
Utilizing best practices in content accessibility
Best practices in collecting and using user data
Effective data collection is paramount for understanding user behavior and preferences. Techniques like forms, APIs, and analytics integration can facilitate the gathering of valuable user insights. However, it’s essential to approach data collection ethically and ensure compliance with regulations such as GDPR, which protects user privacy.
Using this collected data should not only drive improvements but also guide the development of features that meet user needs more effectively. Iterative testing and A/B testing can be particularly useful in revealing which elements of the statistics page deliver the best results, allowing for data-driven adjustments.
Forms, APIs, and analytics integration for feedback
Importance of ethical considerations and GDPR compliance
Real-world applications and case studies
Many organizations successfully implement ReactJS optimized statistics page templates to drive their analytical goals. For instance, a business analytics dashboard project showcased how well-structured visualizations can lead to actionable insights. Through dynamic components and real-time updates, organizations have experienced improved decision-making capabilities.
Another inspiring case is the development of an educational statistics portal. This platform provides insights into student performance metrics, serving both educators and administrators. Feedback from development teams has highlighted the importance of understanding user needs early in the design process, ultimately enhancing user experience.
Case study 1: Business analytics dashboard
Case study 2: Educational statistics portal
The future of statistics pages in web development
As technology evolves, so does the way we interpret and present data. Emerging trends include the integration of AI and machine learning within statistics pages, allowing for predictive analytics that anticipate user needs. This shift can lead to more proactive decision-making processes and a richer user experience.
Additionally, augmented reality is beginning to emerge in the realm of data presentation, providing users with immersive experiences that enhance understanding. As user expectations evolve, incorporating features such as progressive web apps (PWAs) and offline capabilities becomes increasingly vital for engagement.
Integrating AI and machine learning for predictive analytics
The rise of augmented reality in data presentation
Ready to skyrocket conversions?
Supercharge your ad campaigns with high-performing landing pages
Get started