
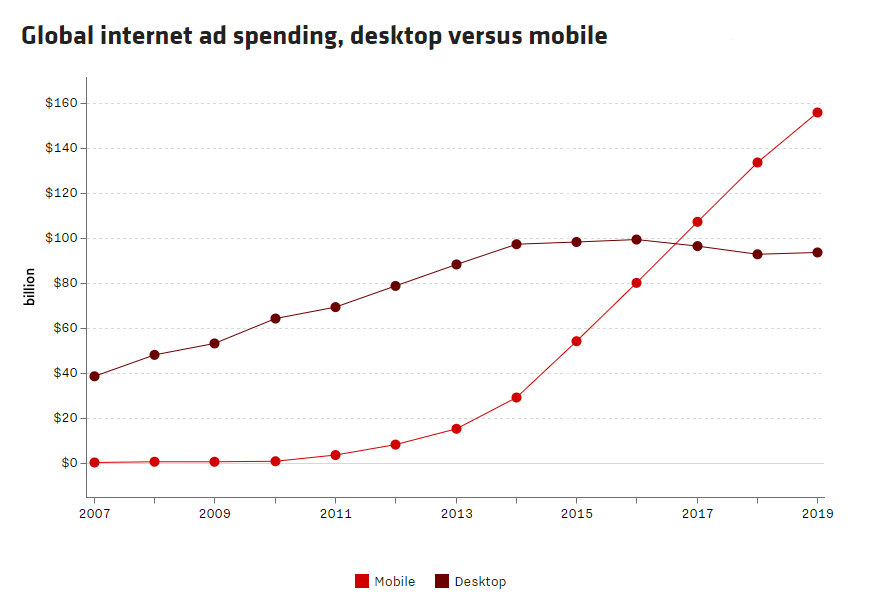
For the first time in history, mobile has grown to represent a larger portion of the digital advertising landscape compared to desktop. According to Zenith’s forecast, mobile spending will reach $156 billion by 2019, accounting for 62.5% of internet expenditure. With the exception of television, that’s more than all traditional media combined:
Unfortunately, many brands are stuck in the early stages of mobile maturity and aren’t prepared to stay afloat in the “mobile first” world surrounding them. In fact, only 32% of marketers have systematically integrated mobile into their marketing strategy, failing to realize that adhering to a desktop-centered approach is a dangerous disconnect that could eventually lead to self-sabotage.
To boost conversion rates, marketers must stay relevant. Most importantly, they must create a positive post-click landing page with mobile post-click landing pages, because this is ultimately where conversions take place.
That’s why we recently announced the first benchmark for mobile post-click landing page performance — The State of Mobile Conversions Report — to give hope to all digital marketers that you can get higher conversion rates if you optimize your pages appropriately:
This comprehensive report provides digital marketers with valuable insights including:
- Why mobile post-click landing pages are integral to improving conversion rates
- Factors that contribute to a high-performing mobile post-click landing page
- Mobile conversion rates across multiple qualifiers
- The post-click landing page software landscape and what to look for in a solution
In particular, it highlights mobile conversion rates across various industries and analyses why some business sectors tend to convert at a higher rate than others. Here’s a brief look…
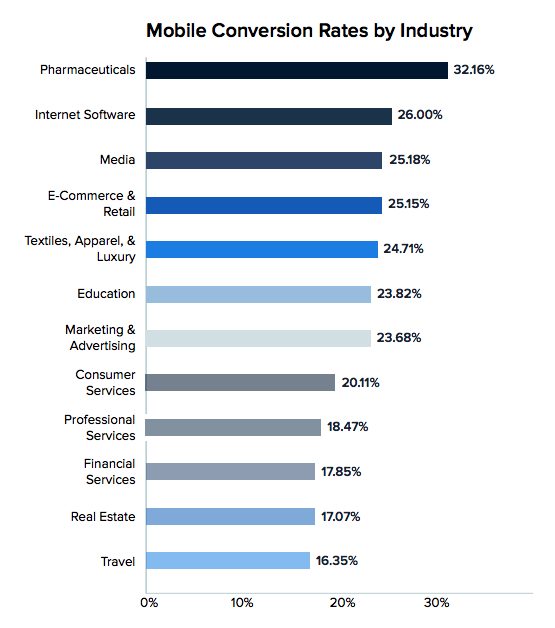
Mobile conversion rates by industry
According to our research, the Pharmaceutical industry takes the lead in mobile conversions, with an average conversion rate over 32%. Internet Software, Media, and E-Commerce come in second, third, and fourth, respectively, with mobile conversion rates ranging from 25-26%. The Travel industry places last with a rate of 16.35%. Granted, that’s about half of the leading industry, but still much higher than the previous industry-reported 2.35% post-click landing page conversion rate:
What’s particularly interesting is that each industry places where it does because of one primary factor: Consumer-facing brands and verticals have prioritized creating mobile apps, rather than optimizing their mobile web experience. This is why industries like Travel have the lowest mobile post-click landing page conversion rates. By investing heavily in their mobile apps, their mobile web presence has suffered.
Conversely, verticals that rely on interacting with users in all contexts and across all devices understand the importance of optimizing their mobile web experience, instead of mobile apps alone. This explains why industries such as Pharmaceuticals, Internet Software, Media, and E-Commerce have the highest mobile conversion rates.
Research suggests that consumers are likely to ignore or delete most of their apps almost immediately after downloading them. This means that an app-focused strategy limits the potential of businesses to get in front of their customers. In contrast, mobile websites appear in search results and can be shared on social media for increased visibility. Frankly, apps don’t generate nearly the amount of conversions as mobile web pages.
3 Mobile post-click landing page examples
In addition to standard post-click landing page best practices, there are three key factors that impact mobile conversion rates: responsive design, personalization, and loading speed.
Now we’ll analyze three post-click landing pages across a variety of industries to see how they implement those first two factors — responsive design and personalization — as well as several other landing page optimization techniques.
(Keep in mind for shorter post-click landing pages, we’ve shown the entire page, but for longer pages, we only displayed above the fold. You may need to click through to the page to see some of the details we discuss. Also note that some pages may be undergoing A/B testing with an alternate version than is displayed below.)
1. BioPharma Dive
First the desktop page followed by its mobile counterpart:
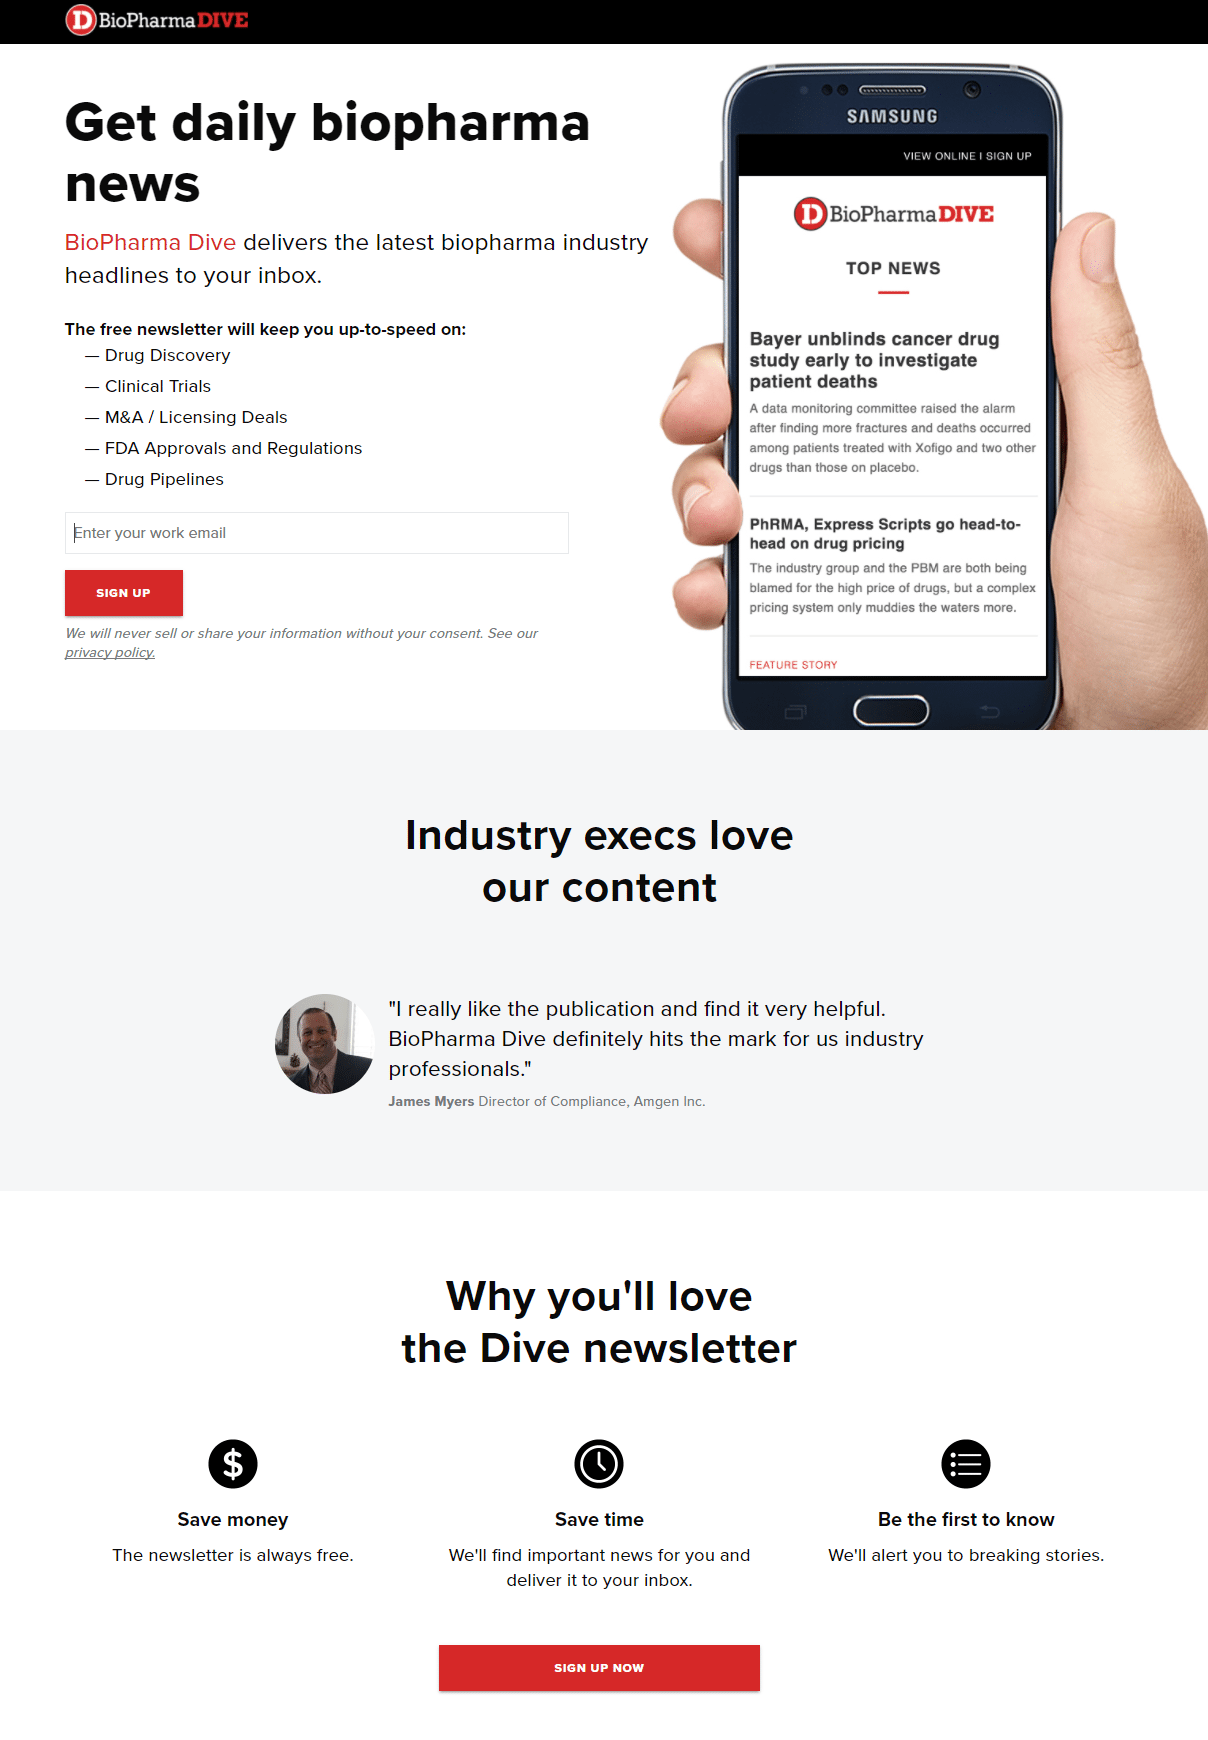
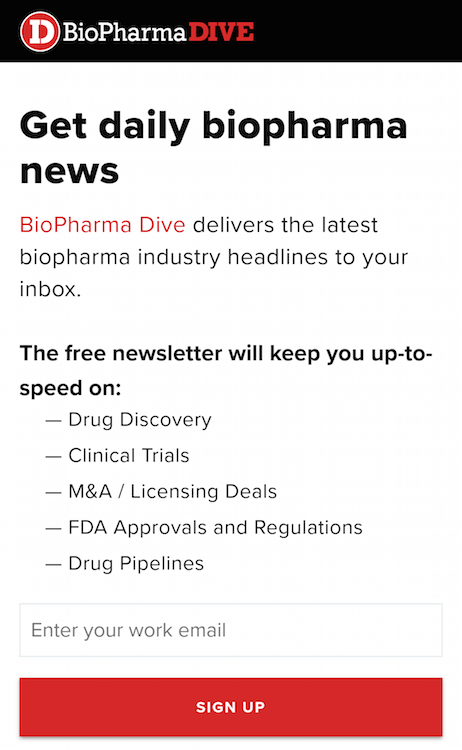
It’s likely that this Pharmaceuticals post-click landing page converts well for several reasons.
First, it’s mobile-optimized, and the image of the smartphone clearly displays this.
The company logo at the top of the page immediately let’s visitors know where they are, and the fact that it’s not hyperlinked to the homepage reduces the post-click landing page bounce rate.
The page headline and subheadline let visitors know exactly what the post-click landing page offer is, and the bold and bulleted copy directly underneath is skimmable, and quickly tells them what type of information their free newsletter will include. The use of first-person copy here — and throughout the rest of the page — helps make visitors feel that the offer is personalized to them.
Only one form field encourages prospects to complete it, and the red CTA button entices them to click to sign up for the newsletter. The second CTA button at the bottom of the page is an anchor tag that automatically takes visitors back to the top of the page to complete the form. Note that highlighting the form field, adding white space, and changing the CTA button copy to something more specific would help draw attention and likely generate more conversions.
The customer testimonial — complete with full name, affiliation, employment position, and headshot serves as social proof, for an even stronger influence on prospects. The privacy policy under the CTA button lets prospects know that their personal information won’t be shared without consent.
Iconography with minimal copy in the “Why you’ll love the Dive newsletter” section adds to the page’s skimmability and readability — two factors that help reduce bounce rate and improve conversion rate. Removing the two exit links from the page footer would also contribute to a lower bounce rate.
2. Spotify
First the desktop view, then the mobile view:
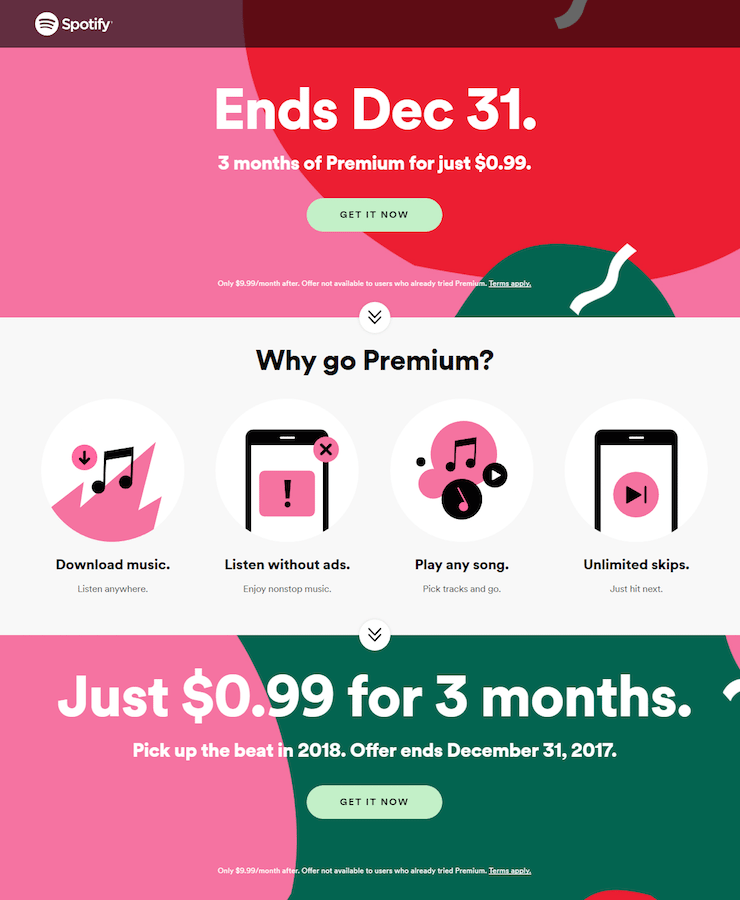

Although the copy isn’t very personalized (no first-person point of view), it does stress a sense of urgency. Letting prospects know that this great offer is time-sensitive and will expire on December 31, 2017 is likely to compel them to act quickly.
The downward-pointing arrows serve as both directional cues and anchor tags, letting visitors know that there’s more to see further down the page, and conveniently taking them there for an positive user experience.
Minimal copy helps make the page aesthetically pleasing and less intimidating, while iconography and various font formatting make it easy to skim, navigate, and digest. The click-through design helps minimize post-click landing page friction as well.
Similar to the previous example, removing the exit links from the page — the company logo in the header and footer, the “Terms Apply” link, social media buttons, and the footer navigation — would likely improve conversion rates.
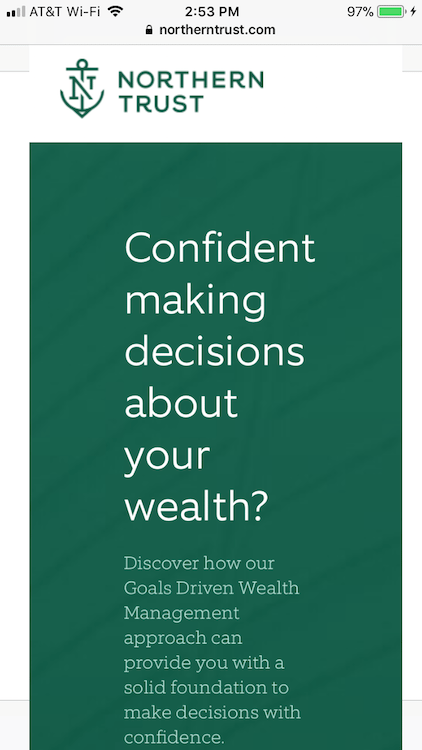
3. Northern Trust
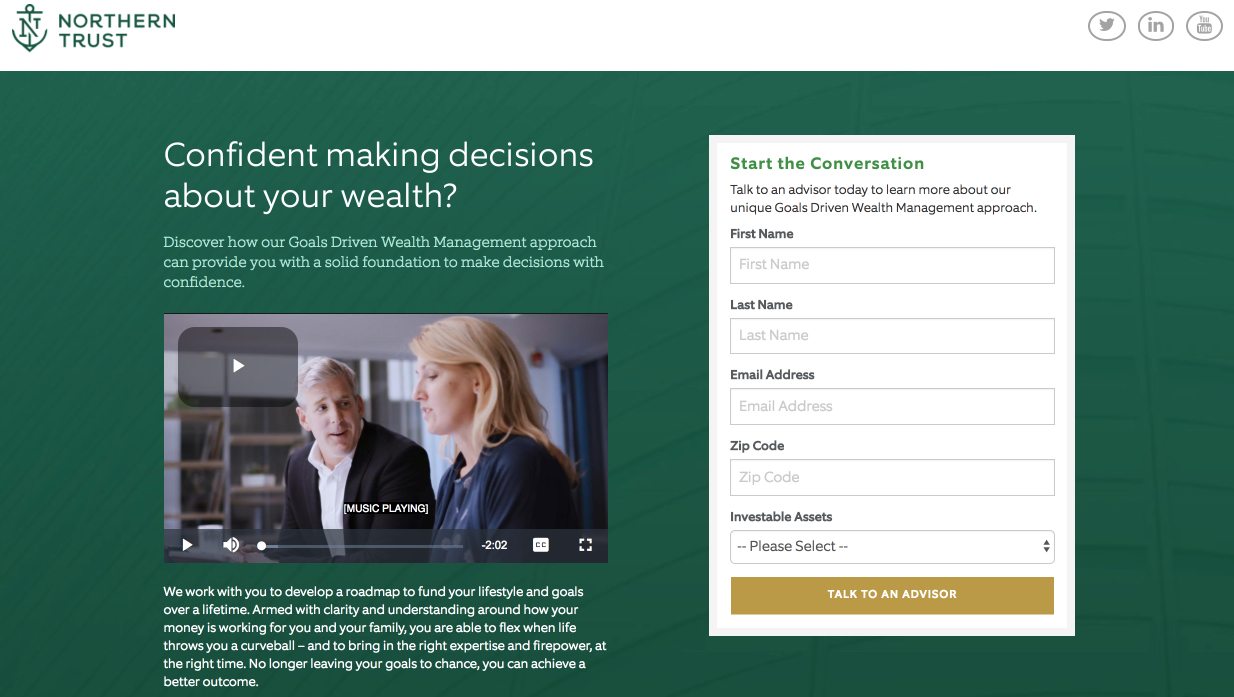
In contrast with the first two examples, this Financial Services post-click landing page is not optimized for mobile. On a smartphone, all of the content is crammed into the middle of the page in one narrow column, which is unfortunate because the page does feature several optimized elements:
The question headline gets prospects thinking about how a financial services company could benefit them. First-person copy helps personalize the offer to the prospect. The video is professionally made, only two minutes long, and contains captions, making it an engaging, interactive way of delivering important information without filling the page with overwhelming copy that most visitors prefer not to (and probably won’t) read.
Encapsulating the form with a frame and color contrast helps draw attention to it. Additionally, five form fields is appropriate for this stage of the marketing funnel, and shouldn’t deter prospects from completing it. The CTA button color contrasts well with the rest of the page, and the CTA button copy is specific and action-oriented.
Even with those optimized elements, the fact that the page is not optimized for mobile is undoubtedly hurting the conversion rates.
Find out more with the complete post-click landing page report
Mobile post-click landing pages stand at the forefront of customer acquisition. Knowing this and the fact that mobile usage will only continue to grow, it’s essential that your content be mobile-responsive and deliver a positive user experience across all devices.
Download the report for more groundbreaking insights, strategies behind mobile conversions, mobile conversion rates across monthly digital advertising budgets and geographic locations, an overview of mobile conversion technology, and more.

See the Instapage Enterprise Plan in Action.
Demo includes AdMap™, Personalization, AMP,
Global Blocks, heatmaps & more.
