
Most sites lose half of their visitors while a page loads. That is a shocking reality that is hard to believe, but maybe not when you factor in the average web page bounce rate is 58.18% today. Even worse, the average landing page bounce rate ranges from 60 to 90%.
Mobile pages are equally affected by slow page speeds. A 2016 Google and SOASTA study found that the average mobile website load time for bounced sessions was about 2.5 seconds slower than that of non-bounced sessions.
Faster loading websites typically generate lower bounce rates, in addition to higher SEO rankings, longer site visits, more engagement, and higher conversion rates. With such a strong correlation between load time and bounce rate, marketers must take advantage of page speed tools for maximum results.
Before analyzing the most trusted tools for testing page speed, let’s look at the most common factors and page elements that affect it.
How is page speed impacted?
When a page request is made, the front-end side and server-side components must both complete their individual operations. So even after you’ve optimized your front-end, you can speed up load time even more by optimizing the server-side (how the page is generated by your server):
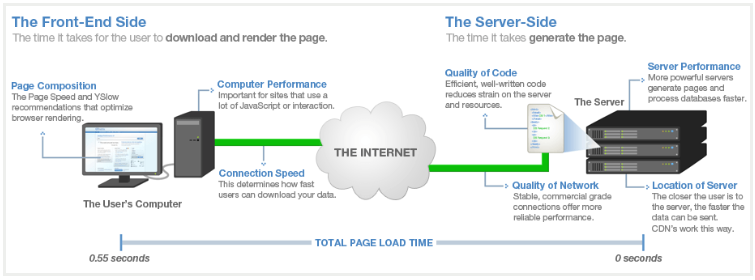
Since both sides are sequential, their cumulative time is considered the total page load time.
Some of the most common factors that slow down page speed somewhere within the image above include:
- Large images and text graphics
- Video
- Page length
- Scripts, fonts, and plugins (HTML, JavaScript, CSS)
- Unnecessary redirects
- Geography (country, city, organization, ISP, network speed)
- Bandwidth
The following tools help test for a variety of these issues, giving you a better understanding of your website’s speed.
10 most trusted page speed tools
Note: Each of these tools offers its own unique features, reporting, and ways to dissect your results, which means you may receive different page load time results. The geographical distance between test location and the server where your website is hosted also plays a role. In addition, running a tool for the first time may be slower, so it’s best to run tests multiple times and take an average of the results.
1. GTmetrix
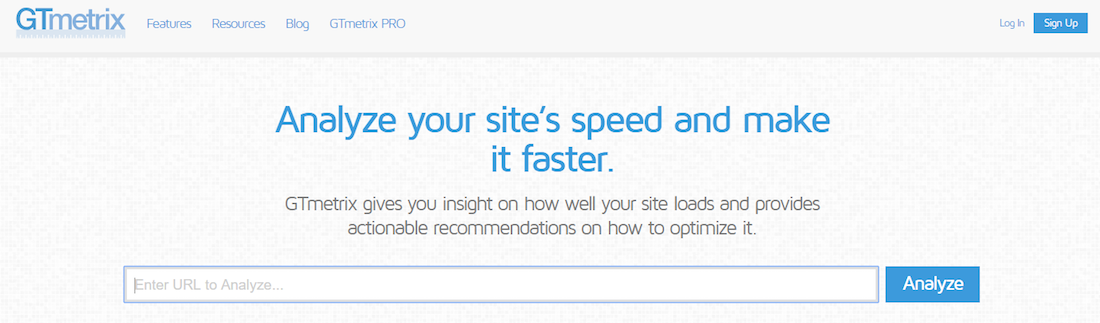
GTmetrix analyzes your site using a combination of 27 page speed recommendations (the Google speed test) and 19 YSlow recommendations (the Yahoo speed test). At the top of the report, performance scores are provided from A to F, as well as page details including load time, page size, and number requests.
Load time is provided as “fully loaded time” by default (the time from when the visitor initially navigated to the page until 2 seconds after there’s no network activity). “Onload time” is optional (when the web page has finished processing and all of the resources on the page, including images, text, and scripts, have finished downloading). The remainder of the report is divided into six different sections: PageSpeed, YSlow, waterfall, timings, video, and history.
GTmetrix allows you to test and compare website performance against various connection types to see how it affects your page load speed. It offers a connection throttling feature to simulate the possible types of internet connections your site visitors might be using: Cable, DSL, 3G mobile, 2G mobile, and 56K dial-up. You can also select Chrome or Firefox as a possible browser.
This tool has 7 test locations, but provides a total of 28 dedicated test servers: 11 in Vancouver, Canada; 5 in Dallas, USA; 7 in London, UK; 2 in São Paulo Brazil; 1 in Sydney, Australia; 1 in Mumbai, India; and 1 in Hong Kong, China.
GTmetrix supports HTTP/2, which loads web pages faster than HTTP/1.1, by attempting to solve many of the shortcomings and limitations of HTTP/1.1. Benefits of HTTP/2 include:
- Multiplexing and concurrency (several requests can be sent in rapid succession on the same TCP connection)
- Stream dependencies
- Header compression
- Server push
Furthermore, GTmetrix is one of the few page speed tools that also offers mobile performance testing. It uses two Samsung Galaxy Nexus phones, so users can generate performance reports based off actual page loads on these devices.
2. Pingdom
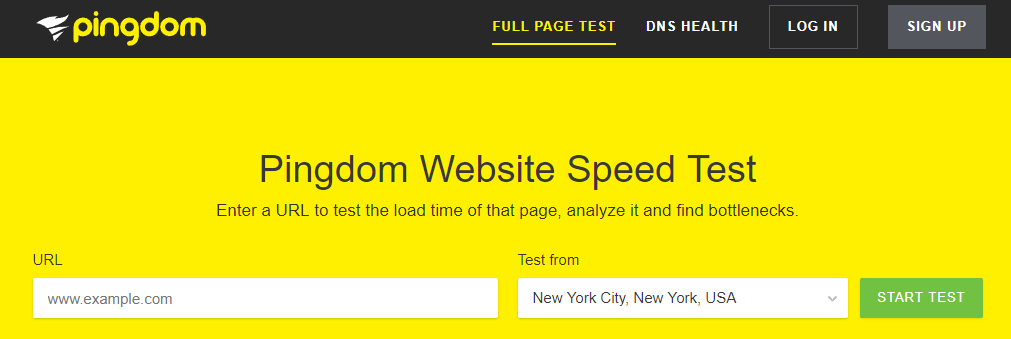
Pingdom allows you to test your website’s speed from 3 main locations:
- Dallas, Texas
- Melbourne, Australia
- San Jose, California
It provides a performance grade based on Google’s PageSpeed recommendations for the free version and YSlow recommendations for the paid version. Pingdom also displays load time, page size, number of requests, and how your site tests against other sites. Additional insights include a break down of the page size by content type, page size by domain, requests by content type and by domain.
One of the main benefits of a Pingdom speed test is that users are provided with performance insights, outlining where improvements can be made. However, unlike GTmetrix, Pingdom only offers onload time (not fully loaded time), doesn’t offer connection throttling, and doesn’t support HTTP/2.
3. Google PageSpeed Insights
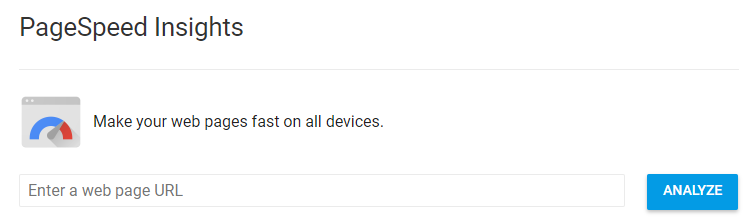
PageSpeed Insights is a Google speed test that provides recommendations for improvements and scores your page from 0 to 100 points, based on two parameters:
- Time to above-the-fold load (the total time for a page to display content above the fold after a user requests a new page)
- Time to full-page load (the time it takes a browser to fully render a page after a user requests it)
The higher the your score, the more optimized your site is and anything above an 85 indicates that your page is performing well.
PageSpeed Insights provides reports for both the desktop and mobile versions of your page. It retrieves the URL twice — once with a mobile user-agent and once with a desktop-user agent. The mobile report includes an additional category called “User Experience” that includes your viewport configuration, size of your tap targets (buttons and links), and font sizes.
The PageSpeed Insights team also recently launched a new page speed tool on “Think with Google,” which is next on the list.
4. Think with Google: Test My Site
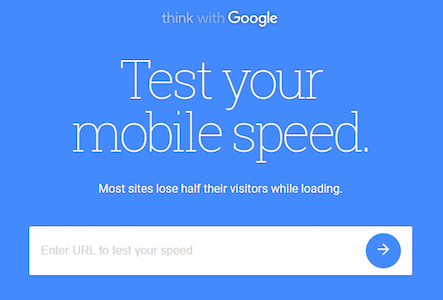
The difference with this one is that it only tests mobile page speeds.
At the top of the results page, are loading time and estimated visitor loss (representing the percentage of visitors lost from your page due to loading time):
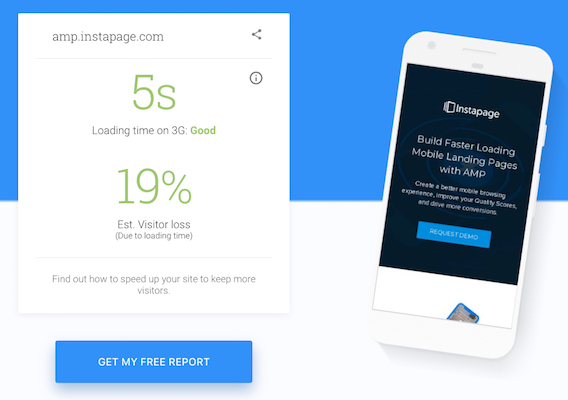
“Loading time” is a Speed Index (not a fully-loaded time), measuring how long the visible page content takes to appear using Chrome on a Moto G4 device within a 3G network. (Note: A 3G network is used for testing because 70% of cellular network connections globally will occur at 3G or slower speeds through 2020.)
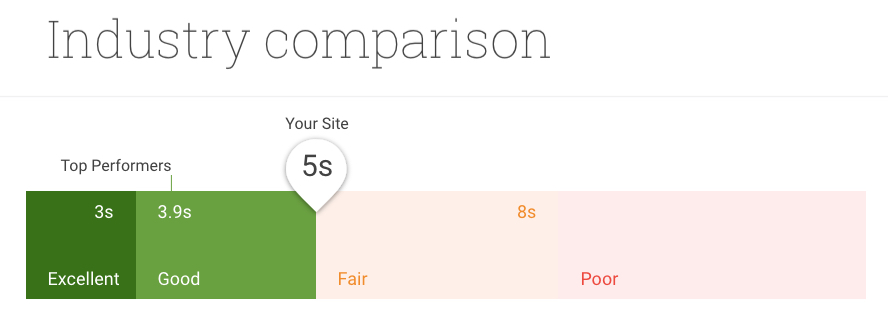
The middle section of the results is an industry comparison, calculated from an internal Google study of over 5 million web pages:
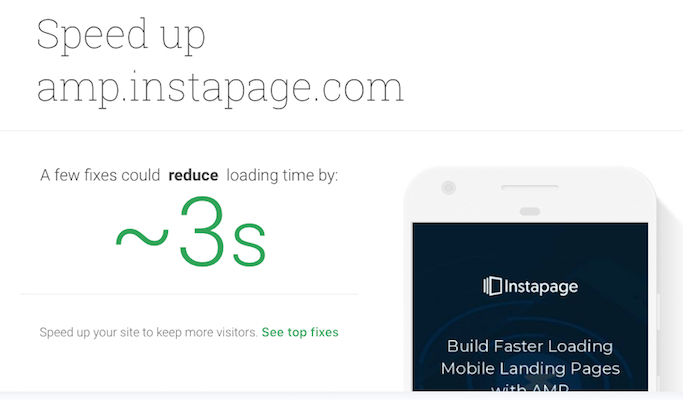
Lastly, the Test My Site tool shows how much time could be saved by making a few fixes to your page, complete with a detailed report of the fixes recommended by PageSpeed Insights:
5. Google Speed Scorecard
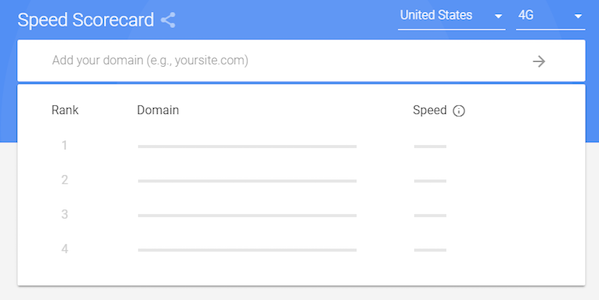
The Speed Scorecard includes thousands of sites across 12 different countries in its database and allows you to compare up to 10 domains to see how your mobile site stacks up. You can also compare your page load speed across both 3G and 4G connections.
Since we discussed how slow page load speeds can affect bounce rates and conversion rates, what about revenue? To give you an idea, Google also included an Impact Calculator to estimate the dollar amount of potential revenue brands could be losing with slow loading pages:
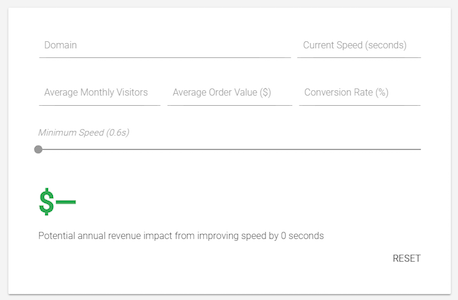
To see your estimated losses, complete the calculator’s fields: domain, current speed, average monthly visitors, average order value, and conversion rate (many of these can be found in the Google Analytics dashboard).
6. KeyCDN
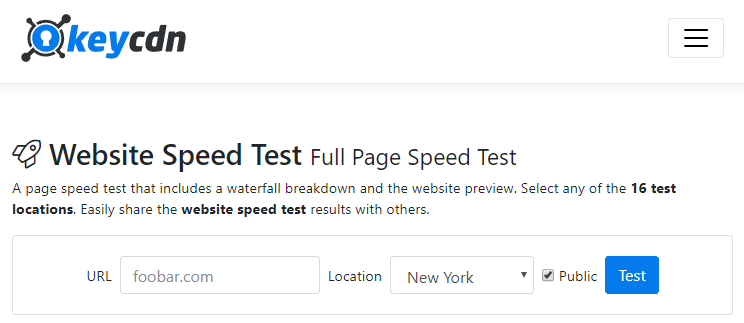
KeyCDN is another page speed tool that works well on mobile devices. KeyCDN offers 16 test locations to select from around the globe with the option to make test results private or share them publicly with others.
The results include a waterfall breakdown with a website preview at the bottom. Within the results, you can see how many HTTP requests were made, the full size of the page requested, and the load time.
7. WebPagetest
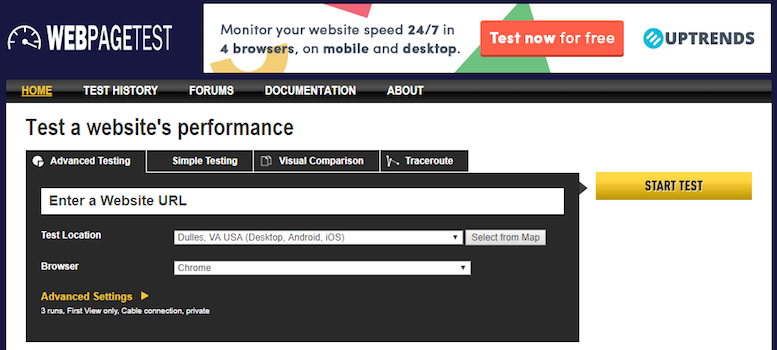
WebPagetest includes over 40 different test locations to choose from and over 25 browsers — including 14 mobile devices. So many test locations are available because anyone can host a test location for WebPagetest, as long as they meet the minimum system requirements.
Tests can be run with a connection throttling feature to simulate potential internet connections site visitors might be using: Cable, DSL, 3G Slow, 3G, 3G Fast, 4G, LTE, Mobile Edge, 2G, 56K dial-up, FIOS, Native Connection, and custom speeds.
It offers a unique testing approach, running a “first view” and a “repeat view.” It also provides more advanced features like video capture, multi-step transactions, content blocking, disabling JavaScript, ignoring SSL certificates, and spoofing user agent strings.
When WebPagetest provides its results, it assigns your site a letter grade from A to F, based on fully loaded time by default, with onload time optional. Other scoring parameters include FTTB, compression, caching, effective use of a CDN, and more. The report is divided into six sections — a summary, details, performance review, content breakdown, and screenshots — providing rich diagnostic information with waterfall charts, Page Speed optimization checks, and improvement suggestions.
One final note is that HTTP/2 is supported by WebPagetest.
8. Dotcom-Monitor
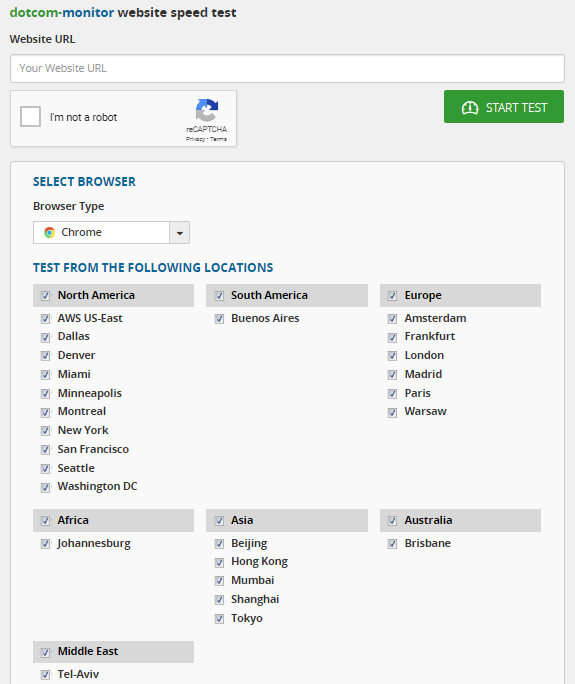
Dotcom-Monitor offers 20 different test locations worldwide and seven browsers, including mobile and cloud-based. What’s unique about this tool is that you can run all geographical tests simultaneously, and then click into each report to learn more about them.
The reports are divided into five sections — summary, performance, waterfall breakdown, host, and errors under which you can find:
- Summary by location
- Browser-based load time testing of all page elements
- Detection of slow/missing elements
- 10% of fastest elements
- 10% of slowest elements
- A comprehensive waterfall chart
- Breakdown by host element (including DNS, connection, SSL, request, first packet, and download)
- Error check and diagnostics
9. Pagelocity

The Pagelocity tool is available and responsive on both desktop and mobile devices. It assigns users a total score out of 100 based on components such as content status, page structure, and coding. The report includes:
- Content summary: Valuable insights about your page’s text content (keywords, headings links, alternative text for images, etc.)
- Resources breakdown: Information regarding your page structure — how many images, scripts or style files it has, as well as render-blocking content and how these factors could be impacting your page load time
- Code tips and insights: Suggestions on how to update your code to be more maintainable and extensible, with useful data about your markup (classes/Ids, tags, Google PageSpeed, Time to First Byte, etc.)
A unique feature of Pagelocity is the competitive analysis with side-by-side metrics that it provides, showing your advantages over your competitors, and any weaknesses they may appear to have.
10. YSlow
YSlow is an open source project that analyzes web pages based on 23 of Yahoo!’s 34 rules for high performance websites. It follows three steps to generate its performance test results:
- Crawls the DOM to find all components (image, scripts, etc.)
- Retrieves information about each component size (gzip, expire headers, etc.)
- Uses the data to generate a grade for each rule, giving you an overall grade
YSlow also offers a page summary with statistics, improvement suggestions, and tools for performance analysis (including Smush.it and JSLint).
To run the YSlow page speed tool, you can use the YSlow chrome extension or get the YSlow results from GTMetrix.
It’s important to note that the scores, insights, and feedback that each of these tools provides are recommendations — not hard, rules or requirements that must be met. Also, realize that you may already be doing what a report suggests, and maybe the tool didn’t catch it.
If you do decide that you need to make a change to make your web pages load faster and provide a better user experience, there are some common ways.
How can brands speed up their web pages?
The tools above are very useful for checking on major page issues that can be fixed easily. So let’s take a minute to address a few of those fixes here.
Optimize images
Ensure images aren’t any larger than they need to be, that they’re in the correct file format, and compressed for the web. 25% of pages could save more than 250KB by compressing images and text, and 10% could save more than 1MB. Regarding video, either leave it out or host the file on another platform (like YouTube or Vimeo) rather than your servers.
Load asynchronously
Opting for asynchronous loading allows elements to load simultaneously, rather than sequentially, to prevent any delay in page load speed.
Minify CSS, JavaScript, and HTML
Optimize your code by eliminating spaces, commas, and other unnecessary characters, removing code comments, and minimizing formatting.
Reduce redirects
Reducing redirects makes a big difference because every time a page gets redirected to another page, the visitor must wait even longer for the HTTP request-response cycle to complete.
Cache your pages
Browser caching means that the browser doesn’t have to reload your entire page when someone revisits your site. By caching information such as stylesheets, images, and JavaScript files, you reduce the number of requests to your server, dramatically speeding up page load time.
Improve server response time
Server response time is affected by a variety of factors: the amount of traffic, resources each page uses, software used by the server, and hosting solution. To improve server response time, look for performance bottlenecks, such as slow database queries and routing, and lack of adequate memory.
Select a page speed tool that fits your needs
Deciding which tool to use ultimately comes down to the metrics you want to track and measure for your site. Despite the differences in functionality, each one provides great value in identifying areas where your site might be slow and providing insights and recommendations for speeding it up.
When designing fast-loading landing pages, nothing can compare to AMP. With a unique framework and minimal HTML, AMP post-click landing pages can load instantly, which provides a great user experience. See how the Instapage AMP builder enables digital marketers to create and publish fast-loading quickly and easily by sign up for an Instapage 14-day free trial today.
Try the world's most advanced landing page platform with a risk-free trial.
