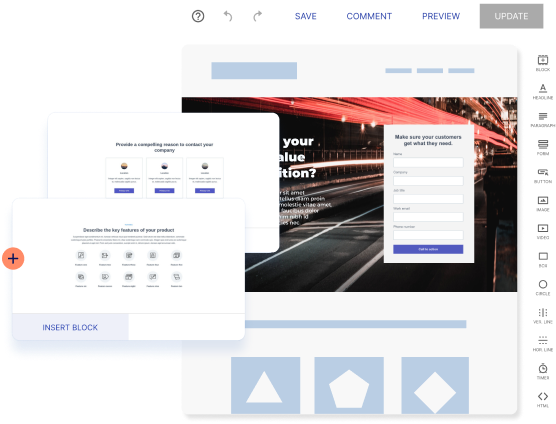
With drag-and-drop landing page builders like Instapage, creating a landing page isn’t a project anymore, it’s just another task. No waiting on design. No chasing dev tickets. Just optimize and publish.
But once your page is live, and traffic starts flowing in, you’re back at your analytics—brows furrowed, asking: Why aren’t more people converting?
You’ve got the clicks. You’ve got a clear offer. So what’s missing?
- Is your CTA getting lost on the page?
- Are people dropping off before they even scroll?
- Is that image helping… or hurting?
Heatmaps help you answer all these questions and more.
They give you visual data showing where people click, scroll, and engage (or don’t), so you can pinpoint friction fast—and fix it just as quickly.
In this guide, we’ll show you what to do if you have the same questions about your page and how to use Instapage heat maps to go from “why isn’t this converting?” to “here’s exactly what to change.”
So, what are heatmaps?
Heatmaps offer an in-depth look at consumer behavior on your pages based on their clicks, taps, and cursor movements. This data illuminates what elements on your page get the most attention and where users drop off.
Instapage offers three types of heatmaps:
- Click maps show where users are clicking on your page
- Tap maps show where mobile users are tapping on your page
- Scroll maps show how far down users are scrolling on your page
The data collected can be used to improve your page layout in several ways. It helps you test what specific conversion influences drive action and identify what information draws customer attention and what goes unnoticed.
This data allows you to maximize visual real estate to show visitors the information they need to sign up, check out, or subscribe.
Testing with heatmaps is more accessible than ever, thanks to Instapage’s A/B testing tool. Deploy two versions of a page and see which one performs better based on the heatmap data—then optimize your content based on concrete results instead up subjective design decisions.
How layout impacts landing page performance
Now that you know how to use heatmaps to optimize your landing page, let’s take a look at the two most popular and effective layouts: F-Pattern and Z-Pattern, named after the movement of a visitor’s eye when they read through a page.
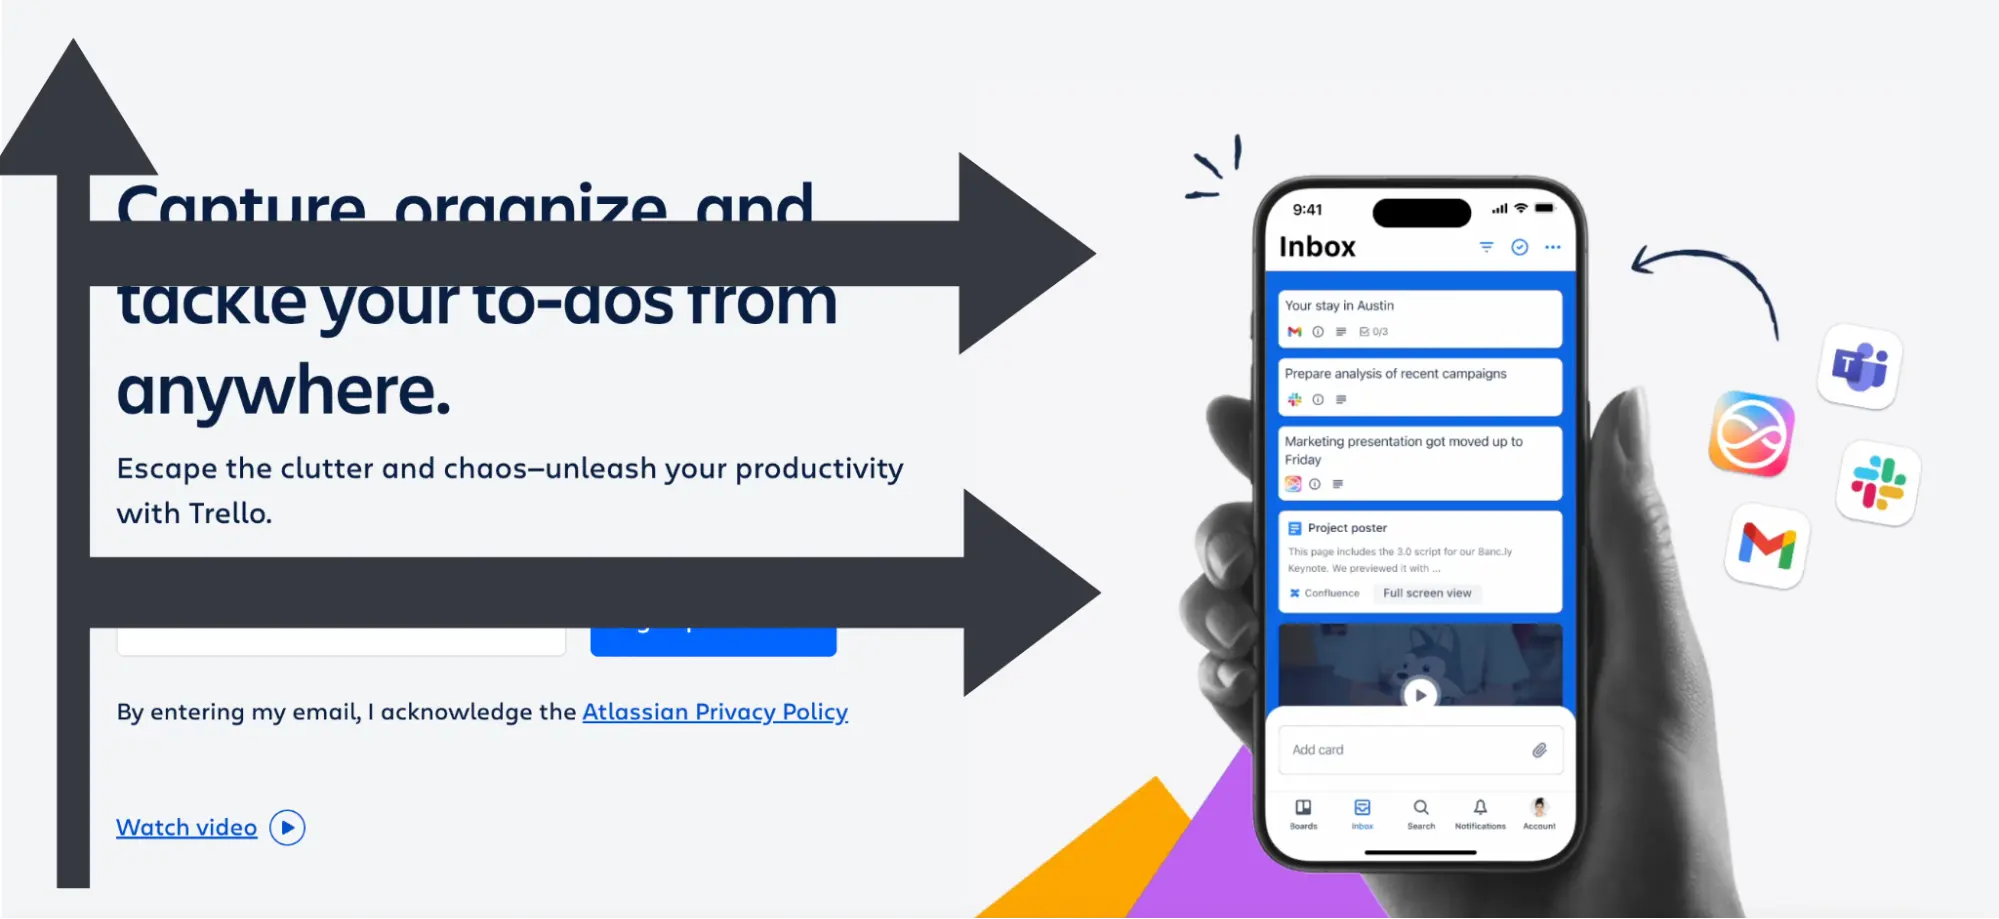
The F-Pattern scans the tops of the page left to right, then down the side, before scanning horizontally left to right again.
The Z-Pattern starts when a visitor scans the top of the page left to right, before moving diagonally to the bottom left corner, and then horizontally to the right.
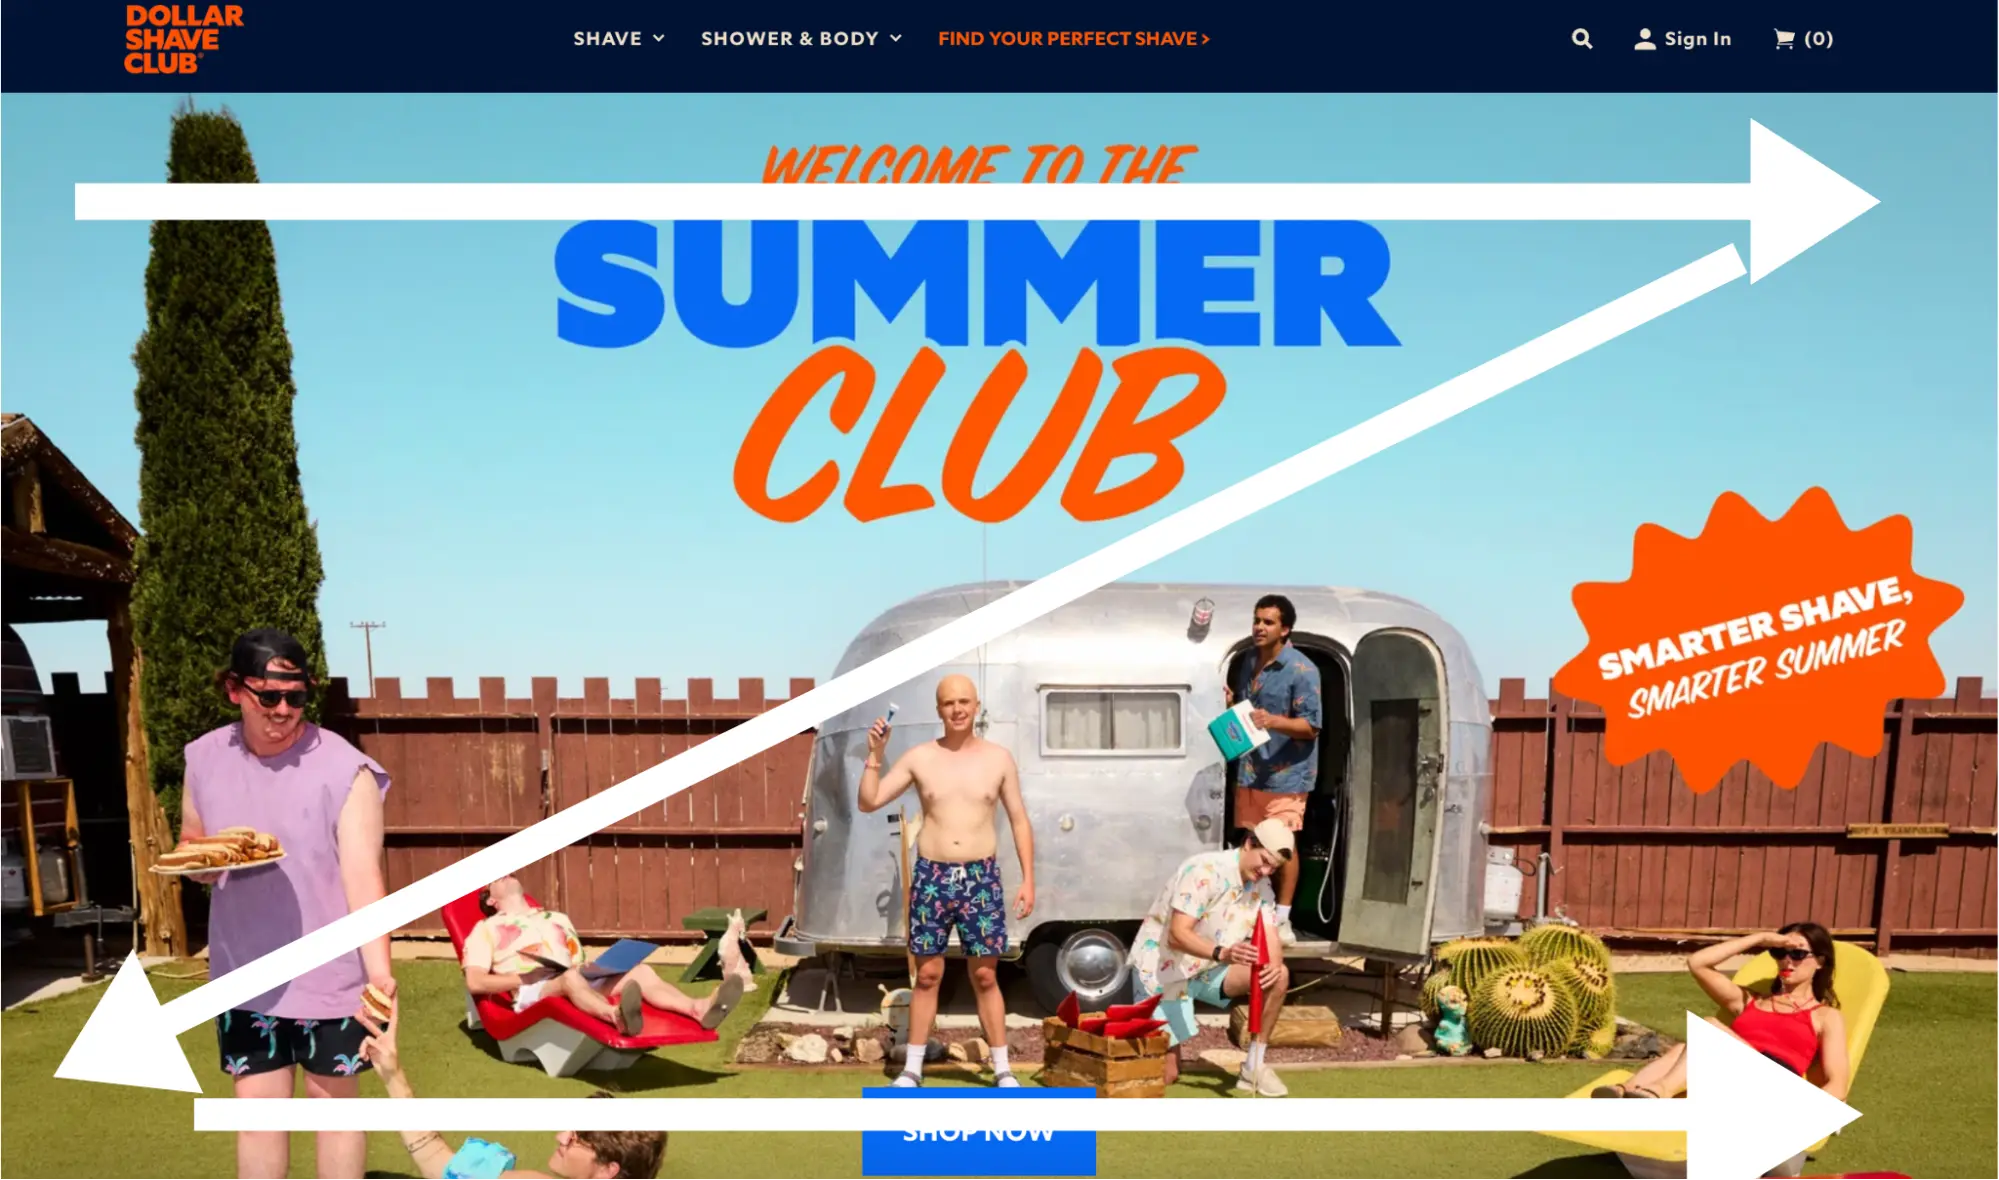
In both of these patterns, put the most relevant page content where people will see it first. That means you should place your value proposition in the top left corner, which is where your visitors will begin. Your call to action should be the other main element visitors see, either in a headline, button, or both. From there, you can use heatmap data to test which pattern works better for your content.
Learn what factors impact performance
Let’s look at some specific examples of how you can use heatmap data to improve your pages.
1. Use click maps to see what elements are getting the most attention
Using click maps can help you understand what parts of your page users are clicking on, which can help you improve your campaign results. For example, if you learn that the “subscribe now” button isn’t getting enough clicks, you can move this button to a more prominent place on the page or change the color to make it more eye-catching.
2. Use tap maps to analyze mobile pages
Just like click maps, you can use tap maps to see what parts of your website or app users tap on when they browse on their mobile devices and, based on this data, create a better mobile experience.
For example, if visitors are not converting at a high enough rate, you may find that they aren’t tapping on the main CTA or that they’re trying to tap on an image or text that isn’t linked to anything. From there, you can make adjustments to deliver a mobile-friendly experience.
You can also A/B test different CTAs at the top of the page or throughout the content to determine which are most effective.
3. Use scroll maps to see how far down users are scrolling
Scroll maps assess how useful visitors find your page content. If users do not scroll down, this could indicate that the information is not relevant or is too long.
You may find that you’re trying to fit too much information on one page and instead need to have multiple shorter landing pages with content geared toward a specific audience. You can also test rearranging sections to address customers’ different pain points sooner, so they convert earlier on the page.
Getting the most out of heatmap data with Instapage
Using heatmaps is an excellent way to build optimized landing pages and improve your campaign results. By understanding where users are clicking, tapping, and scrolling, you can fine-tune your pages to emphasize the most critical elements.
Inside your Instapage dashboard, every published page includes a heatmap—no setup needed. Just toggle to the Analytics tab and get a visual breakdown of how visitors interact with your content.
No spreadsheets. No guesswork. Just real user behavior, made visual.
So what are you waiting for? Sign up for a 14-day free trial to see how heatmaps can help you improve your pages and boost conversions!
