
Experiments are crucial to all marketing campaigns—they help you understand what works and what needs work.
While A/B tests work perfectly when comparing a few variations of your chosen landing page element, the tests are limited when you need to test more than a single page element.
For these occasions, your best choice is multivariate testing.
Multivariate testing, or MVT, allows marketers to compare multiple variables and determine the one that will maximize conversions.
A multivariate test is one of the most valuable optimization approaches, as it allows you to check radical web page modifications and validate multiple hypotheses simultaneously. You can use MVT to optimize your landing pages and ads.
First, let’s find out the specifics of multivariate testing, its goals, benefits and drawbacks, and how it works.
Multivariate testing: Definition, goals, and benefits
Multivariate testing tests multiple variables simultaneously and understands how they interact to influence user behavior. These variables include headlines, images, web forms, CTA buttons and links, and their location on the page. Instead of evaluating several versions of a single element, multivariate hypothesis testing involves systematically modifying the selected variables and analyzing how different components work together.
Elements to test in multi variate testing:
- Copy
- Headlines
- Forms
- CTA placement
The goal of multivariate tests is to evaluate user engagement and identify the winning variation, i.e., the most practical combination of elements to optimize landing pages accordingly. When implemented correctly, this improves conversion rate optimization.
Key benefits of multivariate tests
- Precise identification of conversion-driving page elements. The multivariate hypothesis suggests that in order to boost user engagement, you need to make significant changes to several different parts of the webpage. This provides a data-driven roadmap for future design and content strategy adjustments.
- Elimination of long A/B testing processes. Evaluating all potential variable combinations simultaneously allows you to get the desired results faster, eliminating the need to test every element separately.
- Better analysis of user interactions. An MVT test lets you get the best insights into how different page elements perform and resonate with your audience.
Along with these benefits, multivariate testing has one potential limitation—the amount of traffic required. The more variable combinations you want tested, the more traffic you need to conduct tests.
For example, to test six different page variations, you need to split your audience into six relevant groups, which requires a larger sample size (the number of visitors for each page version).
How multivariate testing is different from A/B testing
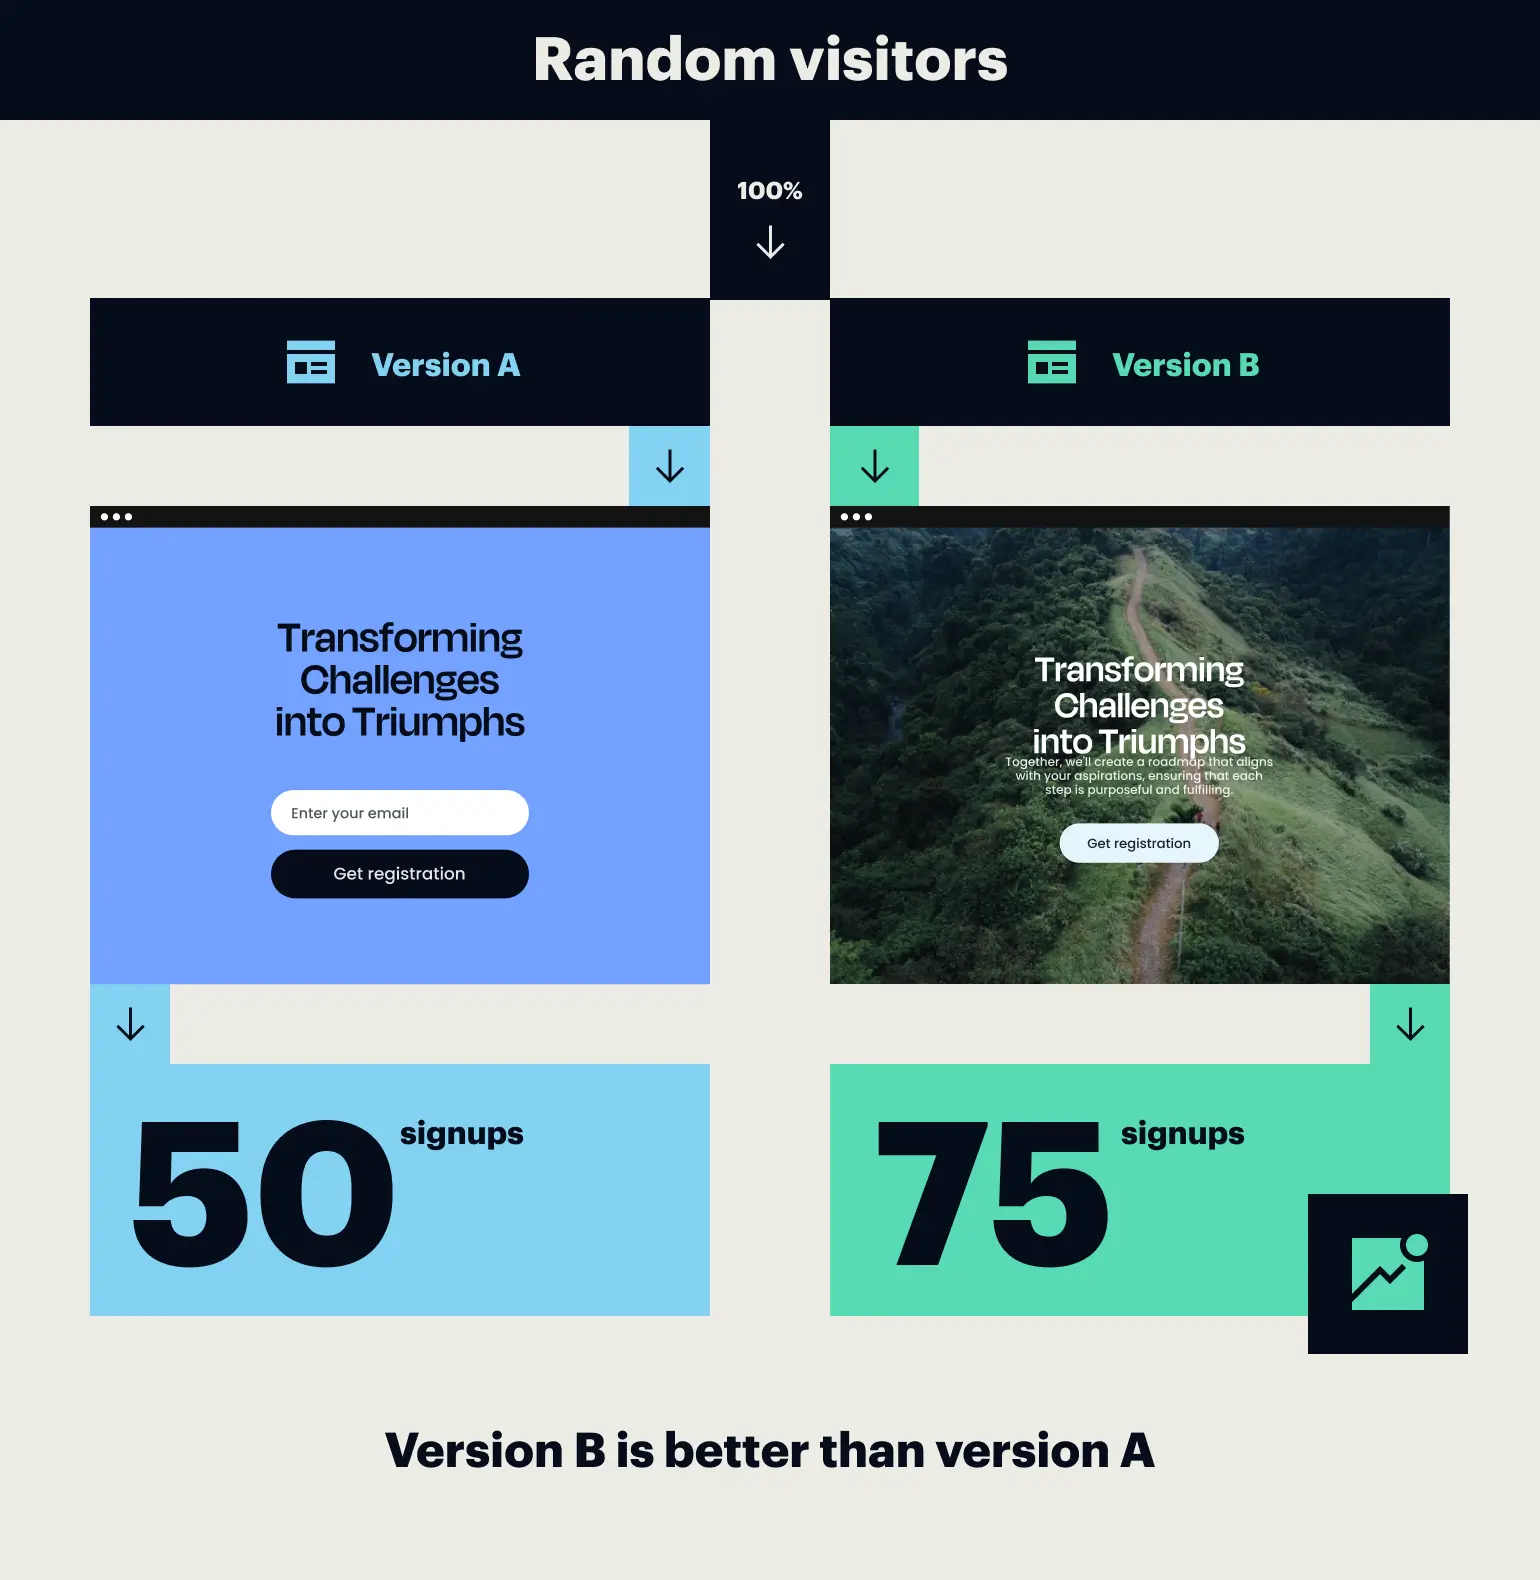
While both A/B testing and MVT methodologies aim to enhance performance and user experience, they are rooted in unique principles and offer distinct advantages. A/B testing, or split testing, is a technique where two test variations (A and B) of a web page or marketing element are compared to determine which performs better to achieve a specific goal.
This process involves dividing the audience into two groups and exposing each group to one of the variations. Marketers can pinpoint the variant that delivers superior results by measuring key metrics like click-through rates or engagement levels and make data-driven decisions accordingly.
This is what an A/B test looks like:
Let’s say you need to optimize a product page layout for an e-commerce website. For an A/B test, you might develop two versions of the product page: Variant A featuring a single, prominent call-to-action button and Variant B featuring multiple smaller buttons scattered throughout the page. By analyzing user interactions with each variation, you can identify which layout is more likely to increase conversions and implement the winning design.
On the other hand, multivariate testing represents an advanced level of experimentation that entails testing multiple elements and their interactions simultaneously. Unlike A/B testing, a multivariate test empowers marketers to assess the effect of different combinations of elements within a single test. This methodology proves beneficial when optimizing complex web pages or marketing campaigns with numerous interactive components.
Here’s what the difference between multivariate testing and A/B testing looks like:
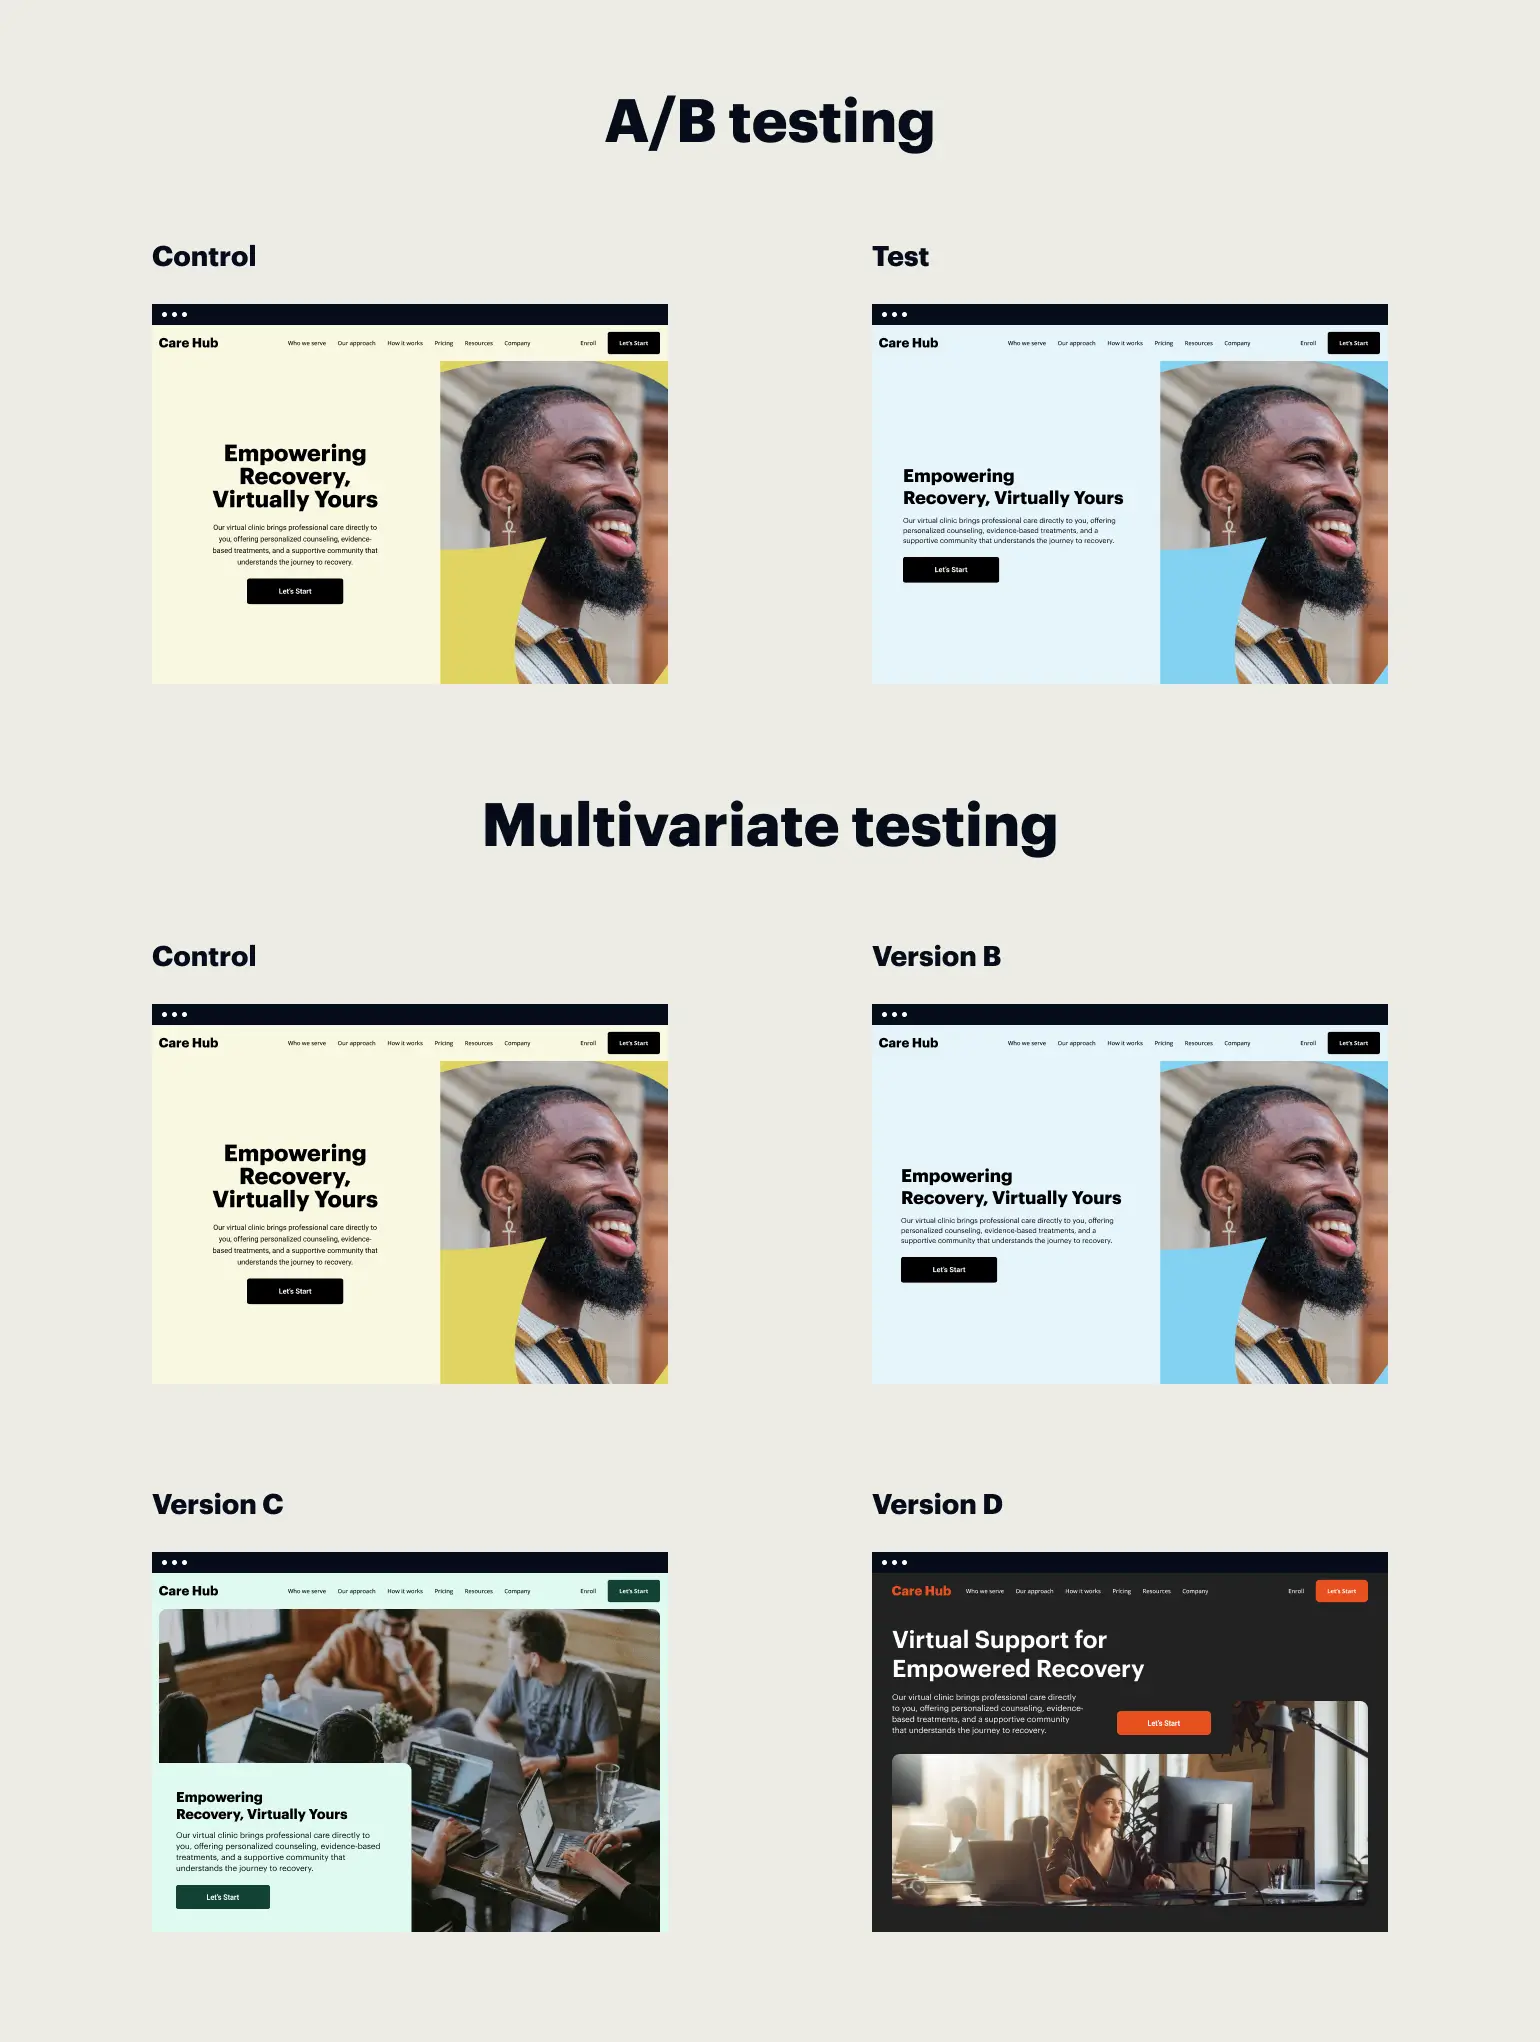
Let’s say you’re looking to enhance the booking process on your travel agency website. Instead of just testing two versions of the booking form, an MVT test allows you to explore multiple possible combinations of form fields, button placements, color schemes, and messaging all at once. By evaluating how these combinations impact conversion rates and other crucial metrics, the website can uncover the optimal setup to enrich the booking journey for users.
And now, let’s look at another example showcasing the difference between multivariate testing and A/B testing. An e-commerce company is selecting the best-performing CTA button for its website. In an A/B test, they will compare options like “Buy now” and “Order now.” The wording change represents a single variable adjustment. For an MVT test, they will need to compare the buttons “Buy now” and “Order Now” in different colors (e.g., green, light blue, and navy blue) and multiple locations on the page, then analyze how these combinations perform.

To sum up, there are several aspects that show the difference between A/B and multivariate testing methods:
- Number of variables. A/B testing focuses on comparing two page versions (A and B) with typically one element changed, while MVT compares multiple variables at the same time. This complexity in MVT influences the overall performance within a complex number of combinations.
- Scope of changes. A/B testing compares different pages with significant changes. In contrast, multivariate testing focuses on subtle variations across multiple page elements to gauge their impact.
- Get more insights.A/B testing aids in understanding the appeal of major page formatting, whereas multivariate testing offers insights into specific page elements’ engagement levels by exposing audiences to various unique combinations.
- Traffic and resource requirements.An MVT test needs enough traffic to guarantee the statistical validity of the experiment. Thus, it’s a more resource-intensive approach, calling for advanced analytical tools. On the contrary, A/B testing can be executed with lower traffic volume and demands fewer resources.
- Testing approach.A/B testing, being more straightforward and requiring less traffic, is ideal for swift data collection and insights. On the other hand, multivariate testing is a more advanced process that analyzes how multiple variables interact, better suited for extensive projects that demand in-depth analysis and experimentation.
The pros and cons of MVT vs. A/B testing
Comparing Multivariate Testing (MVT) and A/B Testing reveals unique advantages and limitations. Understanding these is crucial for digital marketers and web-optimizers. It helps them make informed decisions based on factors like page complexity and traffic volume. Let’s match the key aspects of these experimentation techniques and delve into their strengths and weaknesses.
| Aspect | Multivariate testing | A/B testing |
|---|---|---|
| Experiment complexity | High | Low |
| Testing speed | Slower | Faster |
| Identifying interaction effects | Yes | No |
| Resource intensiveness | Higher | Lower |
| Precision of results | Lower | Higher |
| Sample size requirements | Larger | Smaller |
| Insight into user behavior | Comprehensive | Limited |
| Ease of implementation | Lower | Higher |
| Risk of interference | Higher | Lower |
| Costs | Higher | Lower |
Multivariate testing formula and how it works
You can determine the precise number of web page versions needed for a specific MVT test by applying this formula:

For example, you need to test three versions of headlines and two main images. In this case, the total number of combinations tested will be:

If you need to run an experiment for two different CTA button colors, two CTA wording options, and three headlines, the calculations are as follows:

How to run multivariate tests
There are different approaches to conducting experiments in multivariate hypothesis tests, such as the full factorial, fractional, and Taguchi methods (though the last one is the least popular in online testing).
The full factorial test is considered the most accurate as it checks all variable combinations created based on the described formula. On the other hand, the fractional test checks only the most impactful variable combinations.
What can you test: Multivariate testing examples
Testing specific elements
With multivariate testing, you can test precise details like headlines, images, button colors, and call-to-action texts. Even variables such as font sizes, image captions, or the positioning of a subscription form can be scrutinized. The objective is to assess not only the performance of individual elements but also how the combinations of changes across elements work together to enhance the user experience and conversion rates.
AliveCor wanted to launch its new product, KardiaMobile Card, on their website without hurting the sales of their other products. They ran an A/B test using this hypothesis: website visitors tend to interact more frequently with highlighted elements and products. They added a “New” badge on the new product’s detail page and the product title from the listing page to check if they will see a conversion rate increase across desktop and mobile devices.
Control version:

Variation:


The version of the product page featuring the “New” badge showed a significant increase in conversion rate (+25.17%) and revenue per user (+29.58%) across both desktop and mobile devices. AliveCor chose to keep the “New” badge on the website during the months that followed their new product launch.
Testing complete pages
Beyond individual elements, MVT can be applied to entire pages. This can involve testing different layouts, overall color schemes, or the arrangement of sections within a page. By analyzing how these more extensive changes impact user behavior, businesses can refine their website design with data-driven precision.
Groove, a customer support management platform, used testing to improve their landing pages conversion rate from 2.3% to 4.3% by completely revamping its layout to make it more “copy-first”. As a part of their experiment, they tested different versions of headlines and narratives, aiming to “lead with benefits, not features.”

Optimize your landing page performance with Instapage
Despite all its benefits, multivariate testing might not be the best option for marketers if the test group is too small to get reliable results, or if the variables they’re testing are too connected, which could mess up the findings.
If any of the above factors is the case, A/B testing will be more suitable for refining your existing pages.
Instapage’s A/B testing feature can help you determine if changing one or multiple elements on your landing page can increase conversions.
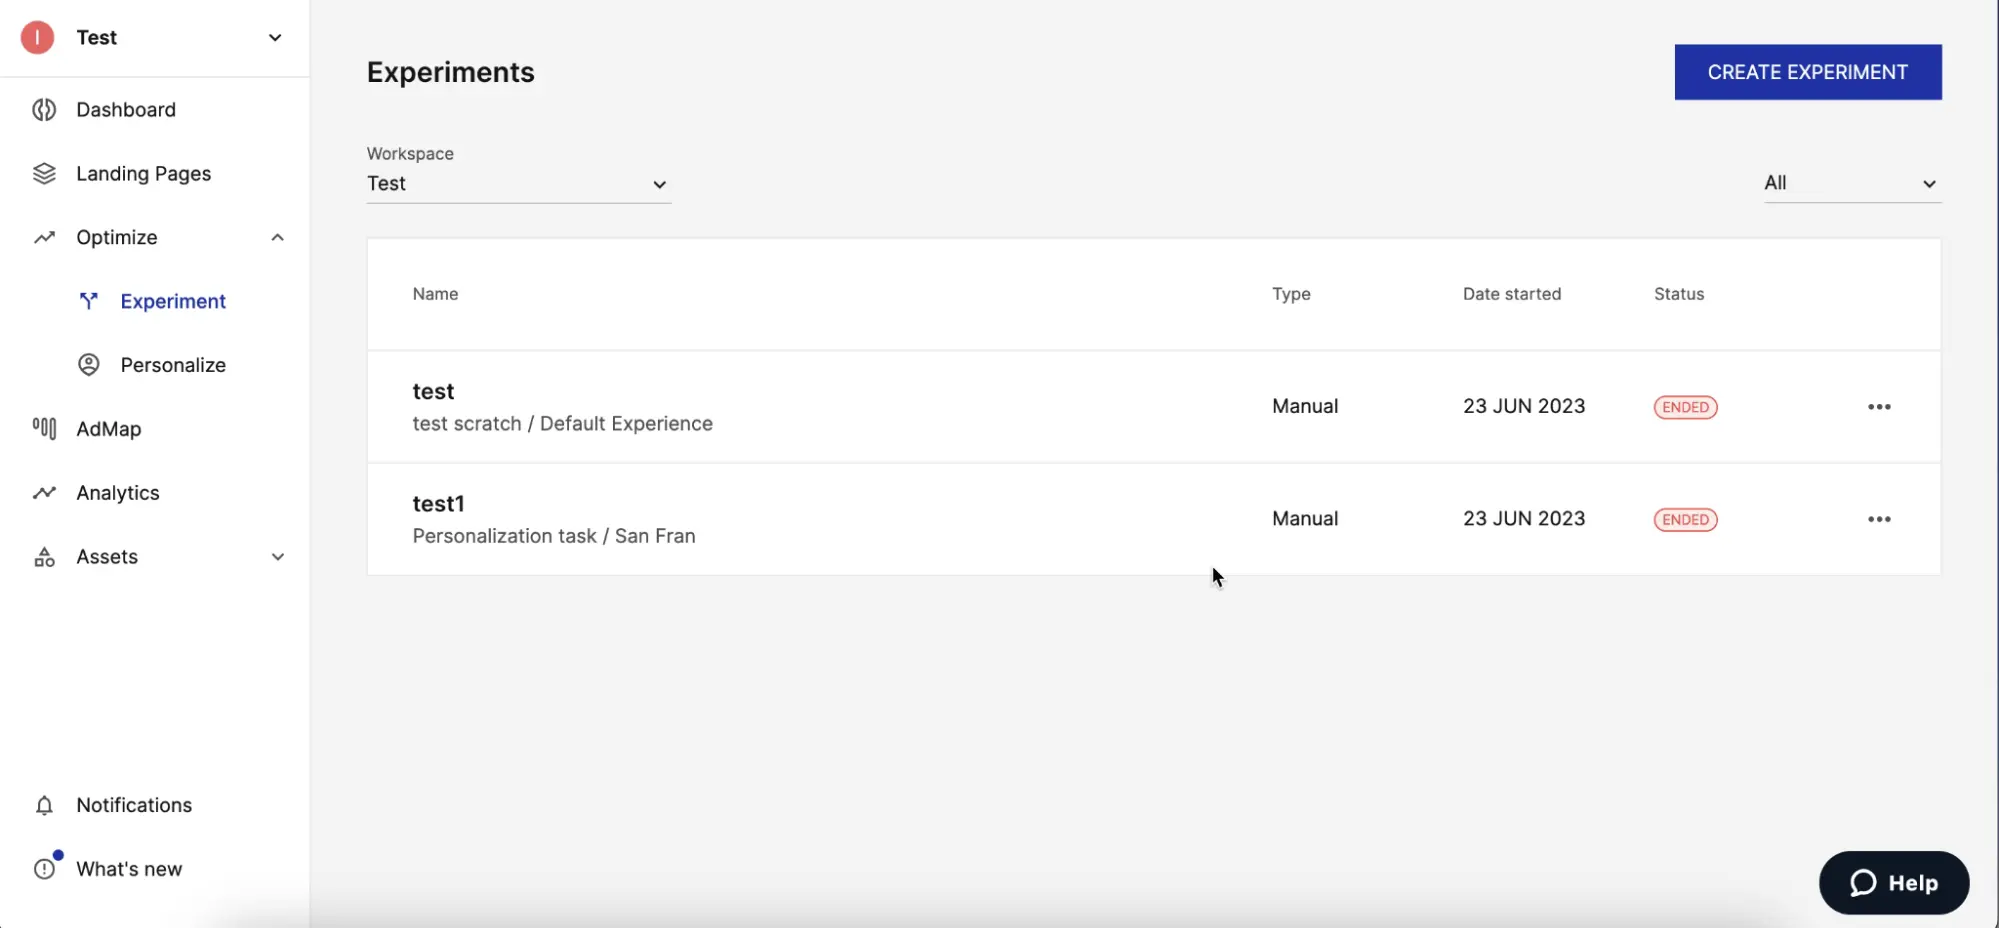
1. To create a new experiment, go to the Optimize tab and click on Experiment on the right sidebar and then on Create Experiment.

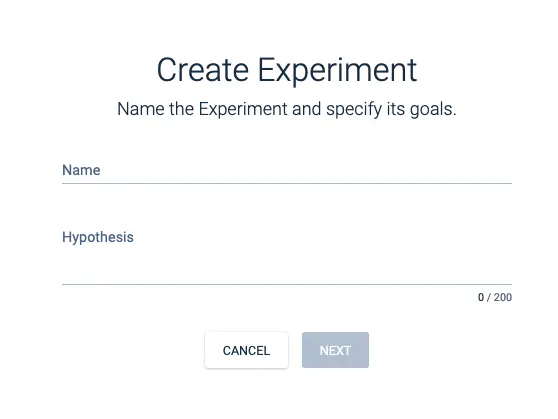
2. Name your experiment and type in the hypothesis you’d like to test.
3. Select the landing page experience that you will be testing, starting with the group the page is in, the name of the page and then the name of the experience, then click Create.
4. Your existing variations will automatically appear in the list. You can choose to add a new variation, edit the variations in the builder, and set the split.
5. When all the changes are made, you can start the experiment.
Learn how to set up and run A/B testing within Instapage. By mastering A/B testing, you’ll gain valuable insights to enhance your landing page performance.
Instapage will empower you with the best optimization tools to help you elevate your landing pages. Sign up for a 14-day free trial with Instapage or request a demo today.

See the Instapage Enterprise Plan in Action.
Demo includes AdMap™, Personalization, AMP,
Global Blocks, heatmaps & more.
