
Today is a big day for Instapage, our customers, and the MarTech industry at large. We think it’s going to change everything and we believe you are going to love it.
Today we’re going to introduce you to an entirely new Instapage, one that we’ve been working on for the past year and frankly since our inception seven years ago. This announcement will include:
- Two brand new products; our most significant yet
- Two completely re-invented products
- New pricing for a new Instapage
But first, I’m going to put some perspective into why today is such a big deal and where we believe marketing is going as we cross into the 2020s and beyond.
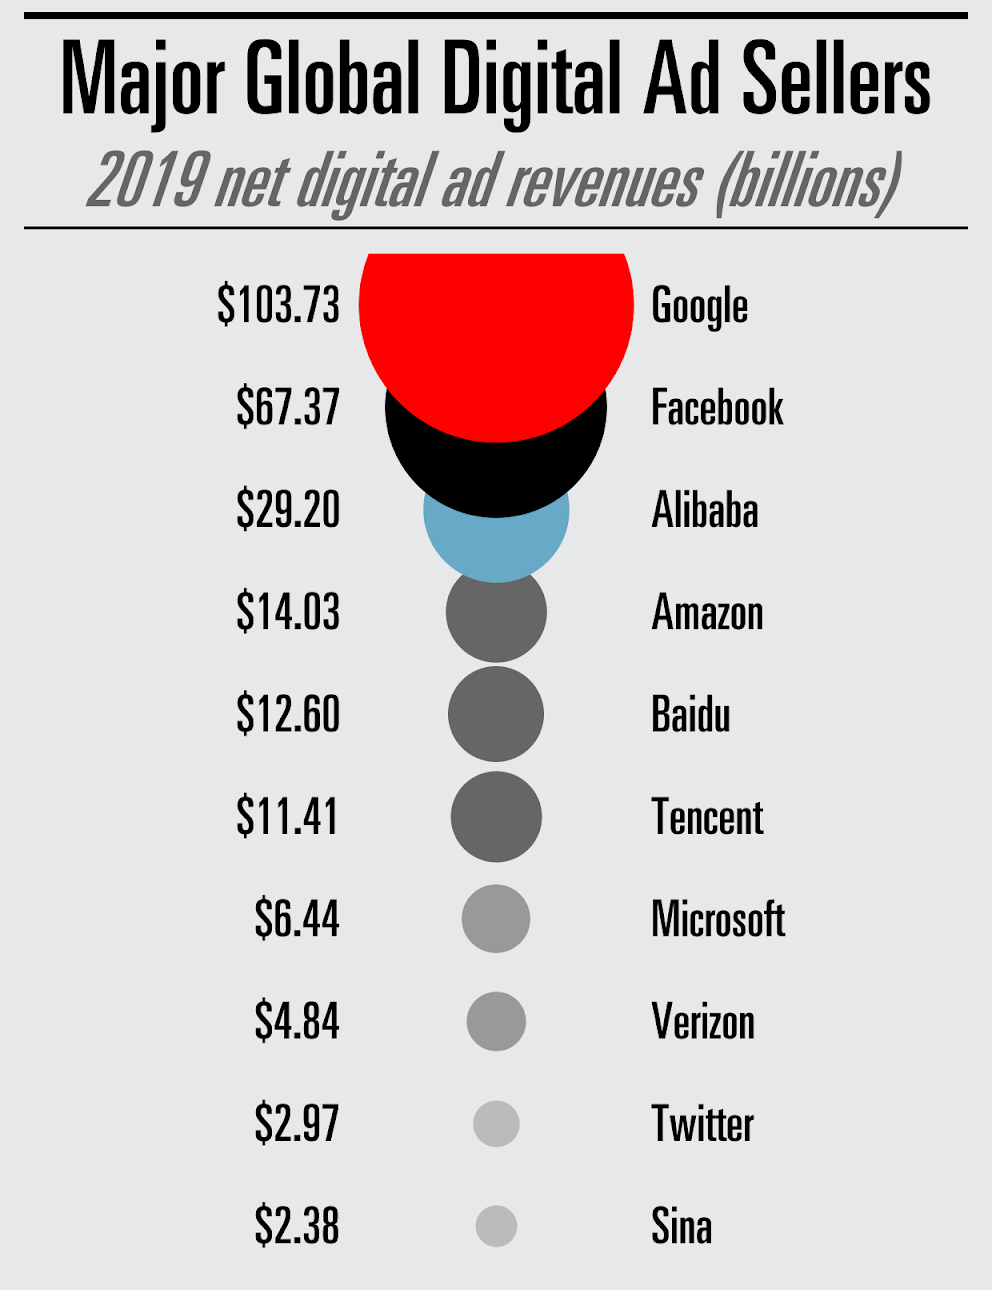
By the end of this year, our civilization, (at least the marketers among the 4.5 billion people online) will have collectively spent over $330 billion on digital advertising. With a growth rate of nearly 18% YoY, we’re likely no more than a decade away from a $1 trillion market: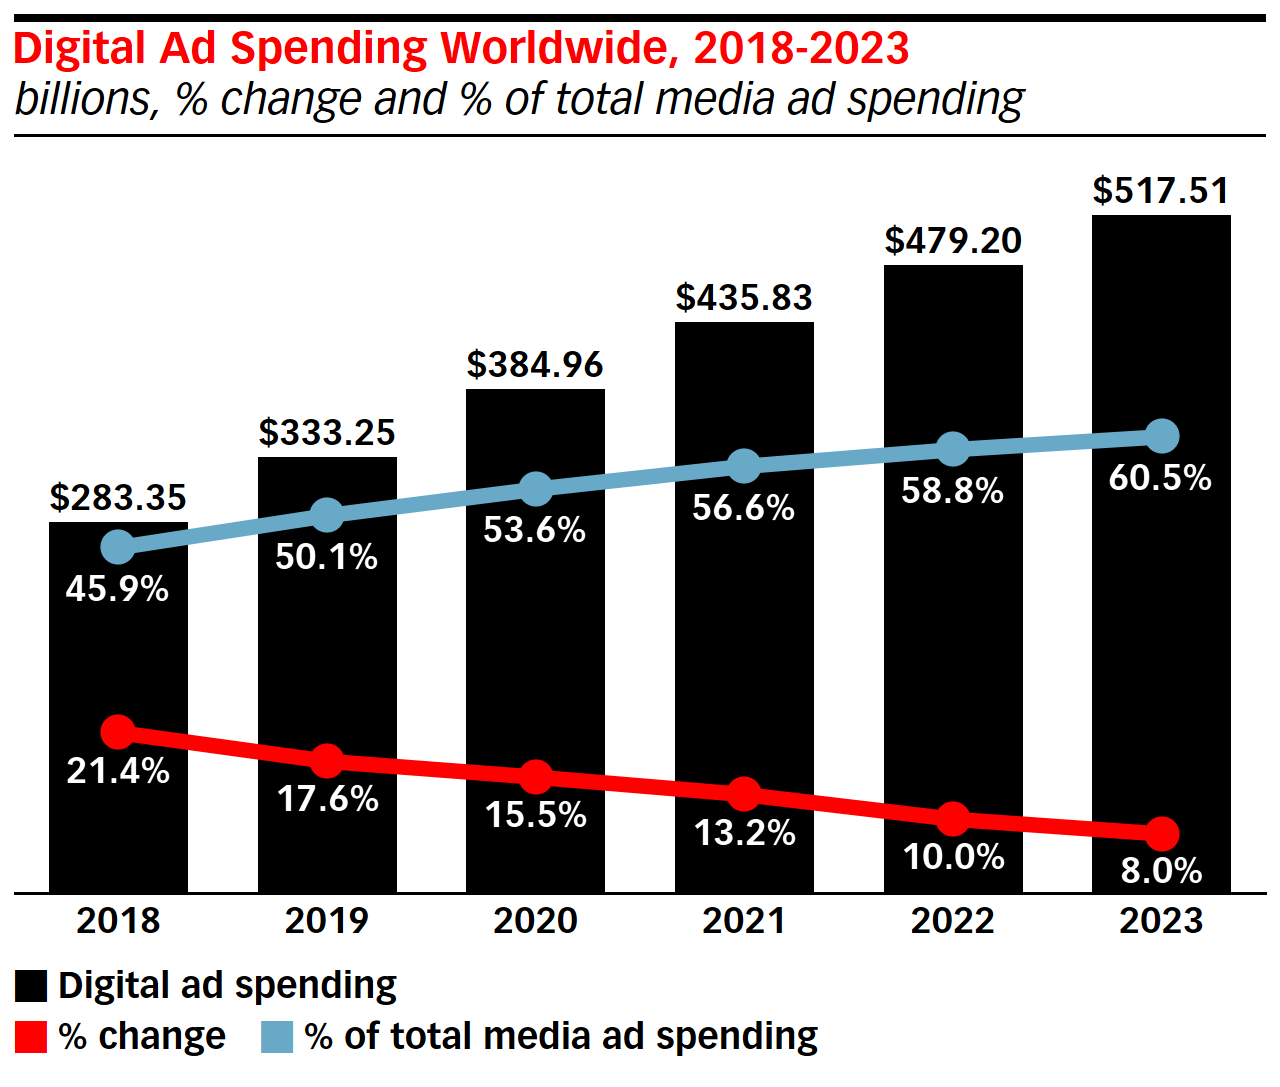 But who’s benefiting from this? I can confidently tell you that it’s not us. It’s Google, Facebook, Microsoft (LinkedIn), etc. They are, after all, collectively worth nearly $3 trillion in market value based on this indispensable industry they dominate:
But guess what? You and I are, on average, turning less than 5% of this massive investment into value. That’s right, 95% of advertising clicks do not convert.
The worst part is that we’ve accepted this. We’ve come to believe that low advertising conversion rates are to be expected, while never asking why this is happening.
But the answer is simple: we’re spending all of our time/money crafting new ads, adjusting bids, and setting up new audiences to target. What we’re not doing is sending our potential customers to a relevant post-click landing page that aligns with the expectations they had when they made that click. And so, they bounce and leave with a negative impression of the brand that we’ve worked hard to build up.
If a potential customer doesn’t think our product or solution is relevant to their intent, it isn’t.
But imagine a world where we prioritized these post-click landing pages? In this world, we’d successfully convince our potential customers that they’re in the right place and that we’re the right solution.
So, if the answer is so easy, why are we not spending more time on the experience that turns clicks into customers? Here’s why:
- Nobody knows how to frame the problem
- Marketers do not knows where to start
- One does not know how to take action
- The complexity is overwhelming
- Ad buyers & creatives operate in silos
At Instapage, we’ve had enough of this. We’re tired of seeing hundreds of billions of hard-earned money going to waste and, more than anything, we’re done with the lack of ad-to-page relevancy.
That’s why we set out to build the world’s first “Post-Click Automation” solution and we refer to it as the Advertising Conversion Cloud™. Post-Click Automation technology closes the last remaining and most significant gap in the customer acquisition funnel and it’s the next evolution in marketing personalization.
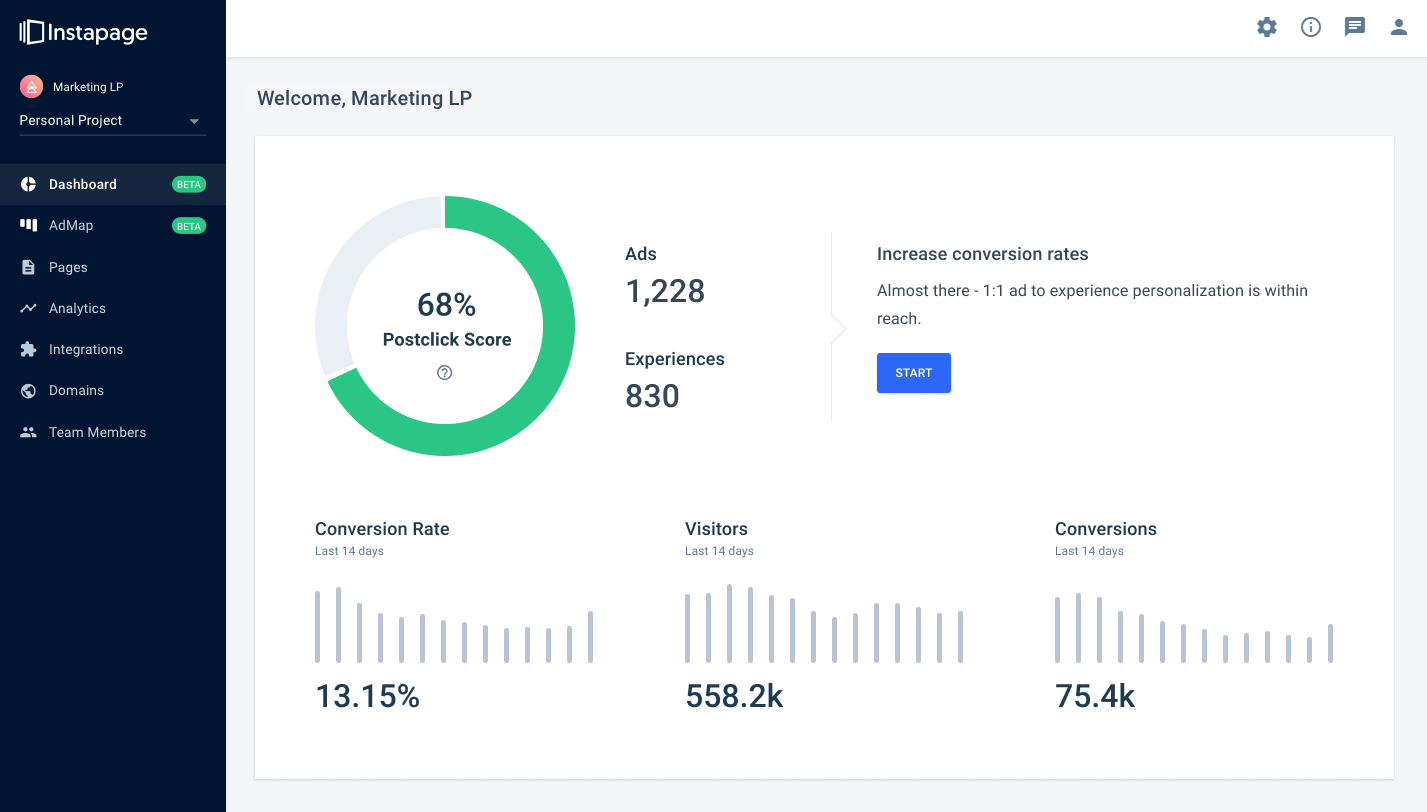
And it starts with your Postclick Score and your new dashboard.
New Product #1 – Postclick™ Dashboard
Shipping: Today with Google Ads
Until today, when you logged into Instapage, you were taken to a list of your landing pages, and that made sense when the product was centered around building pages. However, creating pages is not the goal; it’s a means to an end.
The goal is higher conversions through being relevant. Therefore, we needed to rethink how you convey both that value and the ideal state. With this is in mind, we created the Postclick Score™.
In short, your Postclick Score is the percentage of unique experiences you have compared to the quantity of Ad Groups + Ads you have. Overtime this algorithm will become smarter by analyzing impact (spend, clicks, conversion rate) and more.
We know through billions of unique visitors, hundreds of millions of conversions, and validated by 3rd parties that more personalized experiences = more conversions.
You will now have an ideal state and perspective, for the first time, on where you’re at.
We’re making this available for all customers who transition their pricing to either a Business, Team & Agency or Enterprise plan today.
Turn on your Postclick Score™ – Change your Plan Here
But what good is a Postclick Score if you have no easy way to take action? That’s why we built AdMap™, the world’s first visual ad-to-page mapping technology.
New Product #2 – AdMap™
Shipping: Today with Google Ads
You can think of AdMap as your actionable to-do list of which ad groups & ads need a personalized post-click landing page.
Without AdMap, there is a complete breakdown in communication between the person on your team doing the ad buying and the creative team responsible for producing unique experiences for these campaigns and audiences.
Most of the time, the creative team has no perspective on which ad groups/ads need personalized experiences or who “exactly” a post-click landing page is for; keywords, demographics, locations, etc.
For those customers who’ve tried. We see them trying to keep track of all landing page URLs and personalized experiences in complex spreadsheets. This is incredibly difficult to manage and remain accurate.
Furthermore, the logistical challenge of getting new post-click landing pages created and then published (aka mapped) to the right ad group/ad requires an entire project management process and endless back and forth communication between the ad buyer and the creative team.
We set out to eliminate all of these problems with AdMap. And starting today, your creative team will be able to see what needs a personalized experience. Create that experience, and then automatically push it back to the ad network to become the new relevant destination, all without ever needing to collaborate with the ad buyer.
We’re also making this available for all customers who transition their pricing to either a Business, Team & Agency or Enterprise plan today.
Turn on your AdMap™ – Change your Plan Here
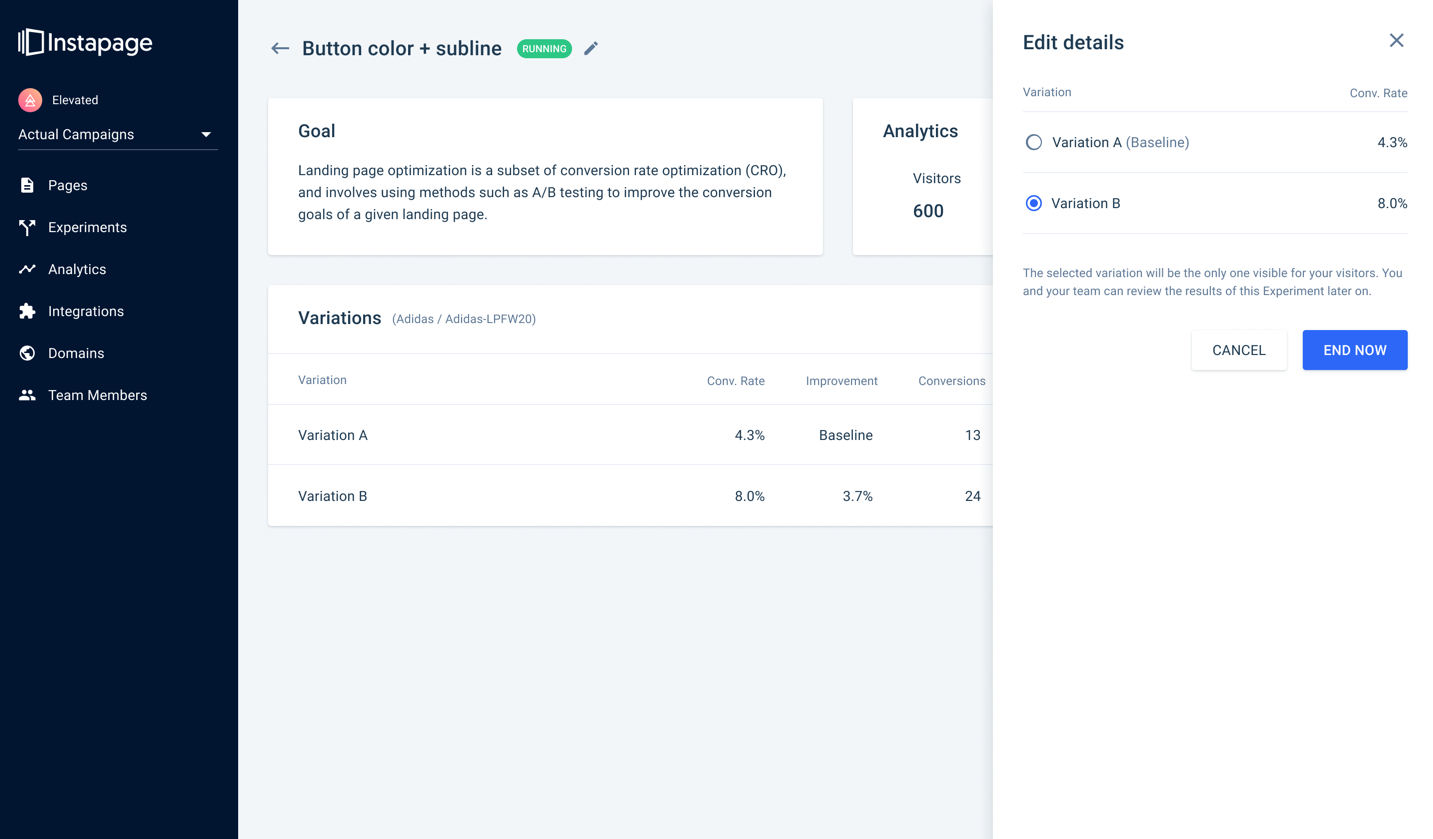
Re-invented Product #1 – Experimentation
Shipping: This year
Not only have we been working on new products, but we’ve also been working on re-inventing two other core products; Experimentation and Personalization.
Since our inception, we’ve included A/B split testing as a built-in feature, accessible from the landing page editor. However, we’ve found that not only is this confusing to many customers who often mistake it for page versions rather than a conversion optimization technology, but finding and managing experiments is confusing without a dedicated workflow.
Because of this and because we plan to expand our Experimentation technology significantly. We are migrating our A/B split testing, and Heatmap features into exclusive product workflows.
You’ll be able to deploy new experiments easier than ever before. And then manage them from a dedicated dashboard, separate from the landing page creation process.
We’re providing early access within the next 2-3 months for all customers who transition their pricing to either a Business, Team & Agency or Enterprise plan today.
Get early access – Change your Plan Here
Stay tuned.
Re-invented Product #2 – Personalization
Shipping: This year
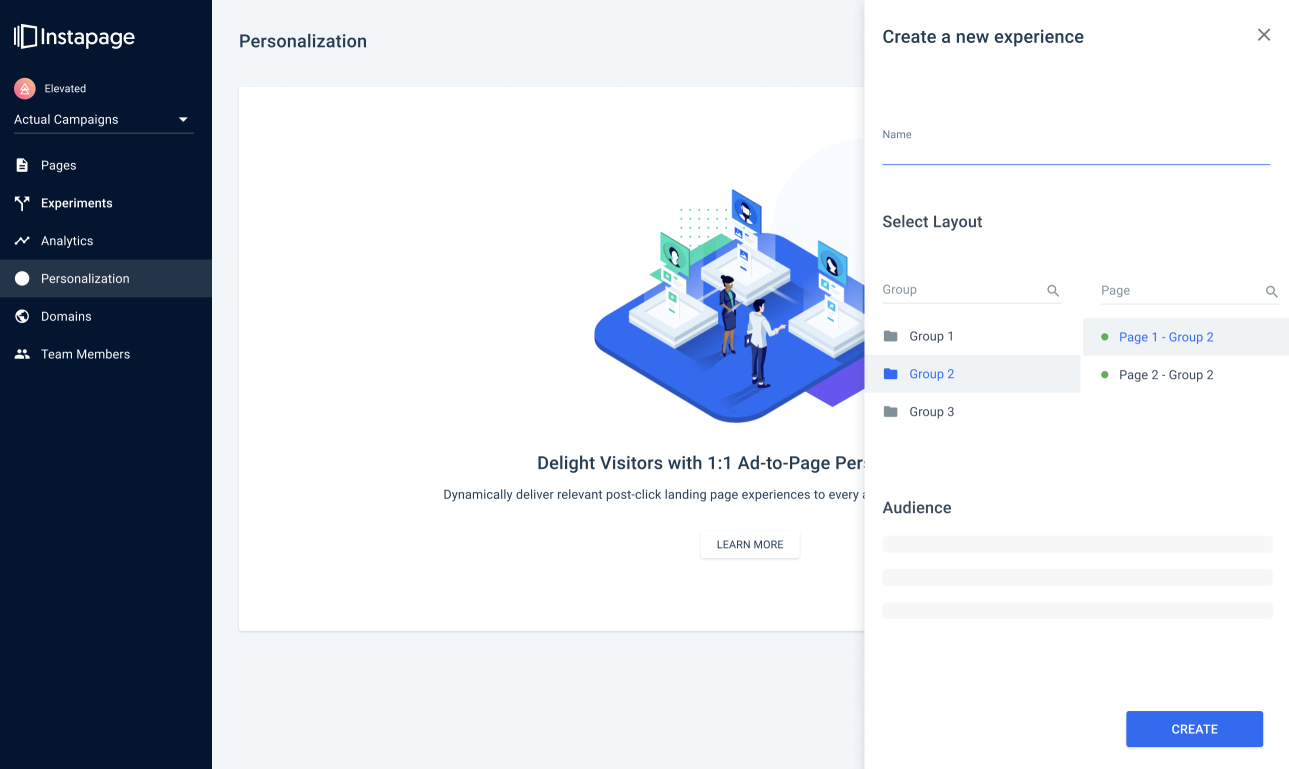
We all know that personalized journeys are the future of digital marketing. Our audience-based personalization technology has already been a game-changer for our Enterprise customers. For the first time, anyone can build a unique audience based post-click landing pages at scale.
However, this workflow was introduced as an interstitial state between choosing a page and the page editing process. We’ve referred to it as the “Experience Manager.” However, this workflow can be confusing, and it diminishes the value of Personalization by presenting it as merely part of the page settings management (also found within the experience manager).
Because of this and because we’re building a lot more technology into Personalization. We’re migrating it to the primary sidebar and establishing dedicated workflows for creating new personalized experiences.
Stay tuned.
New Pricing
Shipping: Today for new product access and December 2019 for everyone.
As of today, Instapage is no longer just a landing page builder. The new Instapage is an Advertising Conversion Cloud, with a mission to “Automate Advertising Conversion.”
To make this move official, we’re introducing these changes as part of our new “Business Plan.” This plan will become the default for all existing self-service customers starting in December 2019. This means that if you choose to stay with us through this evolution (we hope that you do), your pricing will change at the end of this year.
If you’d like to get access to the two new products and get early beta access to our two re-invented products, you can go here right now.
Important Note:
- For Enterprise customers, please contact your Account Manager to add this new functionality.
- For customers still on legacy pricing, you can gain early access by moving to the Team & Agency plan.
Of course, we realize that there will be customers who came to Instapage only for the landing page building features.
However, our ambition has always been to improve advertising conversions by delivering ad-to-page relevancy at scale. It’s time for us to evolve, and we hope you’re ready to grow with us.
Instapage has a lot more in store, and we’ll even be making two additional announcements in Q1 of next year.
Thank you for being here with us.
See your Postclick Score™ and get access to AdMap™ – Change your Plan Here