Whether you’re running paid ads on Google and Facebook or creating email post-click landing page campaigns, without collecting and analyzing advertising metrics, you’re essentially running your campaigns with blinders on.
Advertising metrics help ascertain your marketing campaigns’ progress, what’s working well, and what needs to change. This post will highlight the key advertising metrics you should be tracking when running campaigns on Google, YouTube, and Facebook. (Many of the terms below can also be found in the Instapage Marketing Dictionary.)
Why tracking advertising metrics is necessary
The end-game of every business is growth. You want to increase your bottom line. For digital marketers, this means their advertising ROI must generate positive results month after month. But without an established plan to monitor ad campaign results, you can’t realistically prove your ads are performing well. You must have a list of advertising metrics that are checked regularly so you can adjust your campaigns as necessary — a checklist of sorts.
Analyzing your Google and Facebook ad metrics is a good start. Each metric below will help you measure, compare, and evaluate your campaigns so that you can meet your advertising ROI goals. (Note: Many ad metrics below can also be applied to display advertising and other channels like email and social media.)
Google advertising metrics
Regardless if you’re running paid advertising campaigns in Google Ads or simply tracking website traffic metrics in Google Analytics – the search engine giant provides you with a long list of digital advertising metrics that help you keep a close eye on your advertising ROI.
1. Total site traffic
Total site traffic is the measure of unique visitors that arrive at your website (or post-click landing page) and is an accumulation of seven traffic sources:
- Referral: Visitors who find your website by clicking a link through another website instead of a search engine or any other source listed here.
- Social: Visitors who come from social networks such as Facebook, LinkedIn, or Twitter.
- Organic: Visitors who come from search engine queries who click on a result that doesn’t include “ad” next to it.
- Paid search: People who visit from search ads at the top or bottom of engine searches (highlighted with “ad”).
- Email: Visitors who arrive on your site from an email message.
- Other: These visitors don’t fit into any other traffic source and are tagged as “Other” via a URL parameter.
- Direct: The traffic includes users who come from a source or referrer that is unknown, like a bookmark saved in the user’s browser.
2. Bounce rate
Bounce rate measures the percentage of users who land on your website, perform no action on the page and leave. Google calculates bounce rate as single-page sessions divided by all sessions, or the percentage of all sessions on your site in which users only viewed a single page and triggered only a single request to the analytics server.
A high bounce usually indicates:
- The quality of the page is low, so there’s nothing on the page that users want to engage with.
- The audience coming on the page doesn’t match the purpose of the page.
You can learn how to reduce bounce rate here.
3. Page value
Page value is the average value for a page that a user visited before landing on the goal page (the page where the user performs a specific action) or completing an ecommerce transaction. The value gives you an idea of which website page has contributed more to your website’s revenue.
4. Impressions
This metric is the number of times ads have appeared in paid search ads to people and/or the total amount that your display ad was shown on a third-party site. Impressions can help you calculate brand awareness. However, impressions does not indicate that a user saw your ad, it just means that your ad was displayed.
5. CPM (cost-per-thousand impressions)
CPM is the bid you pay per one thousand views (impressions) when running ads on the Google Display Network. Selecting viewable CPM bidding ensures that you only pay when your ads are seen.
6. Clicks
Clicks help you measure any specific action that users take on your ad or web page and help you understand how well your audience is responding to your marketing message. You can use click triggers to fire tags based on click events in Google Tag Manager. This helps you see when a page element is clicked on a page that matches the trigger conditions.
7. CPC (cost-per-click)
CPC is the amount you pay every time a user clicks your Google ad. Your maximum CPC is the maximum amount you’re charged for a click.
8. Conversions
A conversion is a completed activity and conversions can be either macro or micro. A macro conversion is a completed purchase transaction, while a micro conversion is a completed activity, such as email signup, an action that indicates that the user is progressing toward the macro conversion.
You can calculate conversions after you have specified a specific campaign goal, such as ebook downloads or free trial signups. For post-click landing pages, or email tracking a conversion is a form submission for a content asset like a white paper or ebook but can also include free consultations, product demos, new accounts, etc.
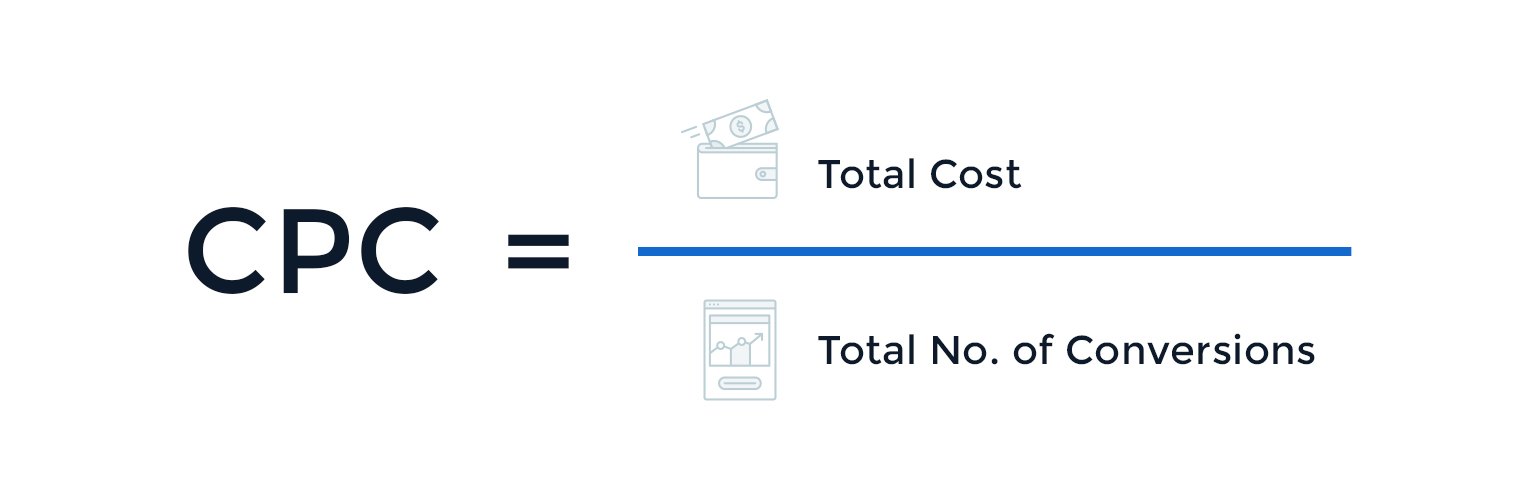
9. CPC (cost-per-conversion)
After you begin tracking conversions, you can derive the cost per conversion by dividing the total cost of the campaign by the total number of conversions for a given date range.
The formula is as simple as that:
10. Average cost-per-acquisition (CPA)
Average cost-per-acquisition is the amount you’ve been charged for a conversion from your ad. The value is calculated by dividing the total cost of conversions by the total number of conversions:
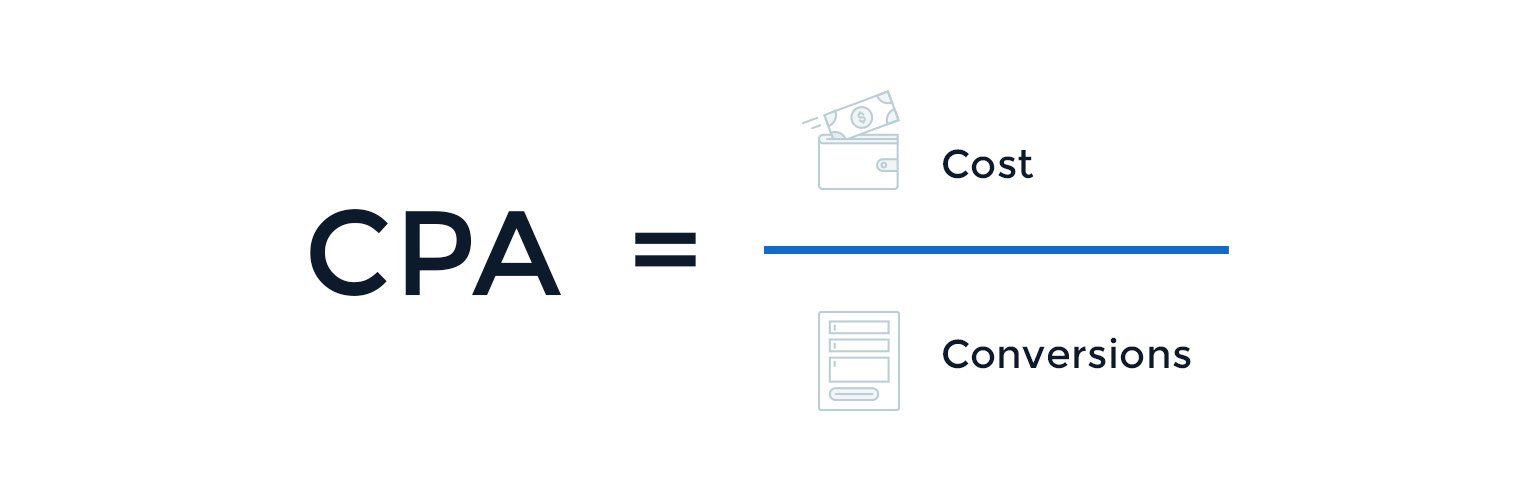
For example, if your ad receives 2 conversions and one costs $2 and the other $4, your average CPA will be calculated as $3.
Understanding your average CPA helps you gather important data so you can better allocate your ad spend across multiple campaigns.
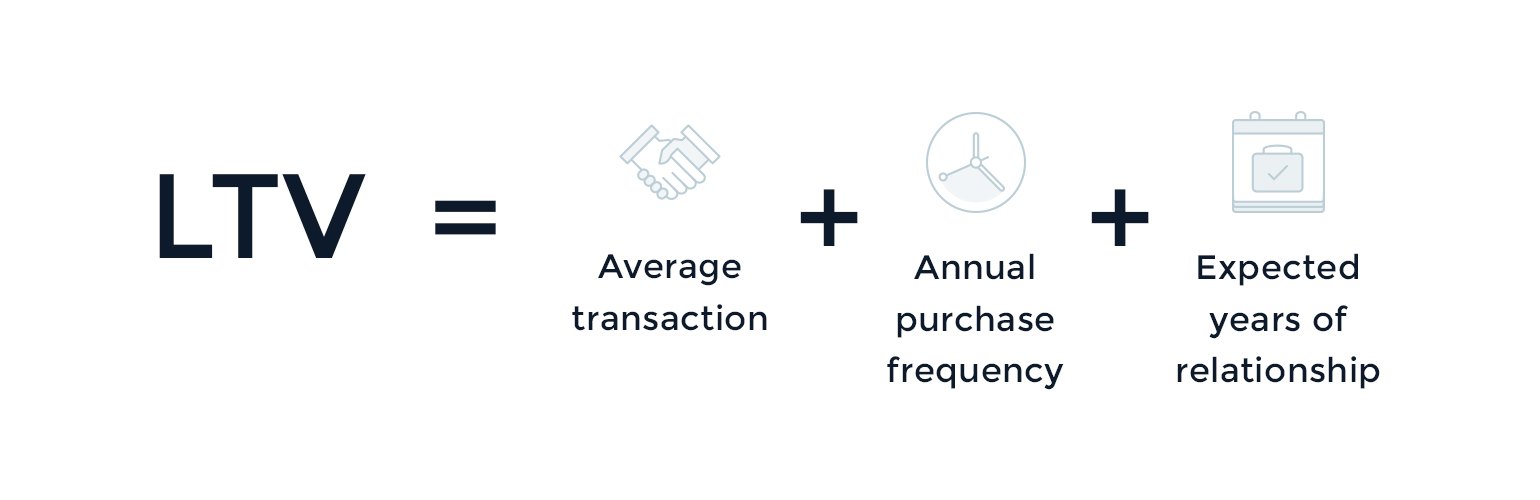
11. LTV (lifetime value)
The Lifetime value report helps you understand how valuable different users are to your business based on their lifetime performance. For instance, you can see the LTV for users who have come through the email or paid search channels. You can then decide the budget allocation for different marketing resources.
LTV is calculated using this formula:
Google lets you see the following metrics for the LTV report:
- Appviews Per User (LTV)
- Goal Completions Per User (LTV)
- Pageviews Per User (LTV)
- Revenue Per User (LTV)
- Session Duration Per User (LTV)
- Sessions Per User (LTV)
- Transactions Per User (LTV)
12. Conversion rates by channel
The conversion rates by channel metric helps you understand which channel is bringing the bulk of your traffic, whether that’s organic, paid, or social media. The more accurate you can be with this metric, the more you can reallocate ad spend accordingly to each respective channel.
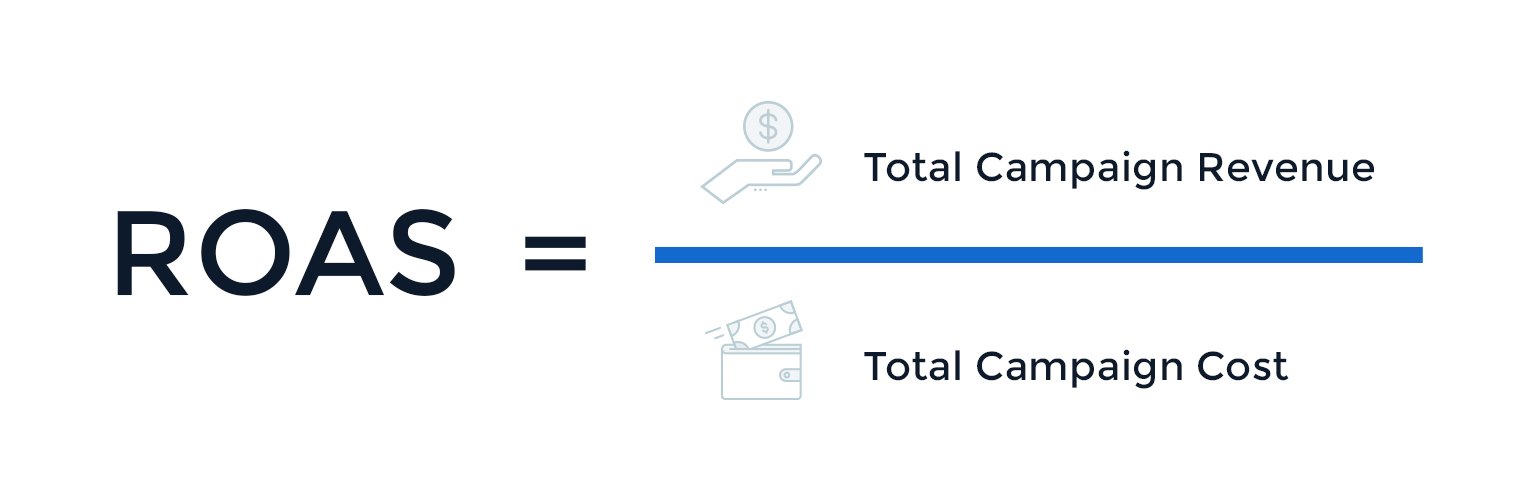
13. ROAS (return on advertising spend)
ROAS helps you understand the return on ad spend from specific ad campaigns, instead of the whole marketing picture which is what Return on Investment (ROI) does.
This is how you calculate ROAS:
14. Engaged visit rate
This ad metric is essentially the opposite of bounce rate and measures the quality of the visits coming from your display advertising campaigns. Engaged visit rate can be calculated by as (100 — bounce rate) as a percentage.
15. YoY comparisons
Year-over-year comparisons provide a more comprehensive overview of your ad campaigns than month-over-month. With YoY, you can account for variables like seasonality or other monthly related issues, like public holidays, to get a better sense of how your campaigns have progressed over a longer period.
16. Quality Score
Quality Score is scored on a 1-10 scale and largely contributes to ad rank for paid search ads on search engines like Google and Bing. Both platforms collect user’s feedback in the form of click-through-rate (CTR), ad relevance, and post-click landing page experience — all of which help determine Quality Score:
Higher quality scores help advertisers gain a higher position in SERPs. When you have a higher Quality Score, you can get a higher ad rank than an advertiser who may have a higher bid but has a lower Quality Score.
- Expected clickthrough rate: The expected CTR determines whether your keyword is likely to get a user to click your ads. Google Ads takes into account the past performance of keywords based on your ad’s position. Both ad platforms provide an expected CTR for a keyword of your campaign based on the assumption that the search term will match that keyword exactly.
- Ad relevance: Ad relevance is a status that measures the message match between your keyword and your ad. For example, Google and Bing determine if someone searching for a keyword you’ are bidding on sees your ad is relevant to the search query.
- Post-click landing page experience: Both Google and Bing measure post-click landing page experience by determining how relevant your post-click landing page is to your ad, and how much it relates to the user’s search term. The post-click landing page experience status describes whether the post-click landing page provided a good experience for the visitor who landed on the page after clicking the ad.
Now, onto YouTube advertising metrics…
YouTube advertising metrics
17. Cost-per-view (CPV)
CPV measures how much you spend each time a user engages with your ad on YouTube or views it for at least 30 seconds (or the entire duration if it's shorter than 30 seconds). Fortunately, advertisers are in control of bids because you can make adjustments as necessary, and you will never pay more for a view than your bid amount.
18. Earned actions
Earned actions include any action that a user takes after seeing your ad — subscriptions, likes, and additional video views. The more actions you receive signifies that users had a deeper level of interest and engagement with your ad content and, by extension, your brand.
19. Video viewership
Also known as “quartile reporting, this metric measures ad completion rates for videos connected with your linked channel. The video viewership metric gives insights into how often people watch 25%, 50%, 75%, or 100% of your video.
Facebook ad metrics
The social network collects a lot of data to help you improve your Facebook ad campaigns. To view your campaign performance, navigate to the Facebook Ads Manager, and view real-time ad reporting. There, it tells you what’s performing for your campaigns and what’s working against them, like the following metrics:
20. Reach
Reach calculates the total number of users who have seen your ads on Facebook and includes both paid and organic views.
21. Impressions
Impressions measure the number of times your posts were seen and give you a general idea of how viral your Facebook ads and posts are. Note: If the same user saw your posts multiple times, Facebook counts it as multiple impressions.
22. Engagement
Engagement measures the number of times a user took action on your ads or sponsored posts. The action can range from clicking on the link, sharing the post, leaving a comment, and/or a reaction. To track the metric for your Facebook posts, go to Facebook Insights.
By measuring engagement, you get to know how the target audience is responding to your sponsored posts, which content they prefer, and which they ignore.
23. CTR (click-through-rate)
CTR shows the percentage of people who see your ad and click through to the post-click landing page. WordStream’s Facebook CTR data concludes that average CTR for Facebook ads across all industries is a dismal 0.90%:
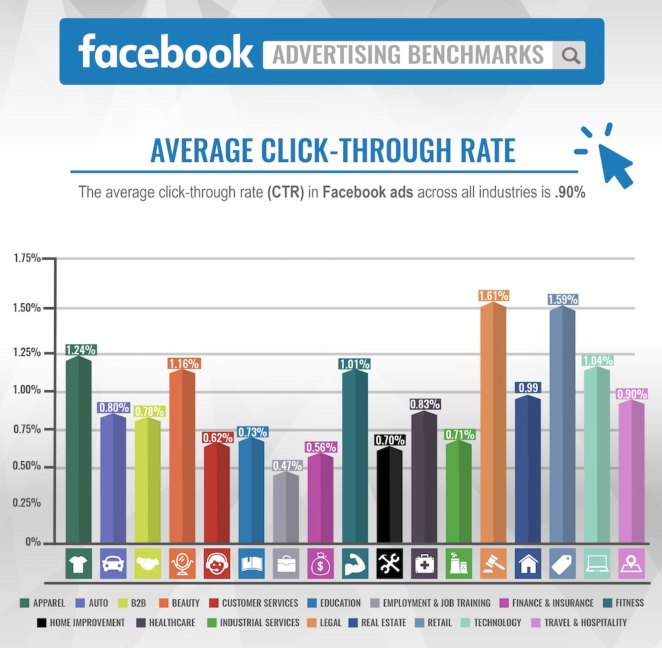
A low CTR compared to a high ad reach and impressions signifies that users are seeing your ad but aren’t clicking through. If your ad CTR is below average it’s best to A/B test your ads to see what your audience responds to best.
A higher ad impression and a lower ad CTR allows Facebook to assume that your selected audience doesn’t find your ad relevant, which has a negative impact on your ad relevance score.
24. Cost-per-action (CPA)
Instead of simply measuring clicks and impressions, cost per action measures costs based on a specific user action (app download, free trial sign up, etc.). By measuring CPA, you can determine whether the money you spent on ads was worth it. Ultimately, you can see which ads lead to a higher CPA and create similar ads to increase your Facebook advertising ROI.
According to WordStream, the average CPA in Facebook ads for all industries is $18.68.
25. Ad frequency
Ad frequency measures the number of times your target audience viewed the ad. Keep an eye on ad frequency to ensure that the same people don't see the same Facebook ad continuously, as this can cause banner blindness and lead them to ignore the ad altogether.
Once you’ve analyzed these important ad metrics, Facebook gives you the opportunity to split test your ads that lead to better ad performance.
Metrics help you answer the question, “what is a good ROI for advertising?”
Without continuously monitoring your advertising metrics, you cannot determine what ads to pause or modify, reallocate spending, etc. The quantifiable data and metrics above empower you to understand whether your advertising ROI is on par with others in your industry.
Use Instapage’s Advertising Attribution Solution and leverage the platform to not only create optimized post-click landing pages, but track cost-per-visitor and cost-per-lead for paid and organic traffic.
Generate maximum results from your paid ads starting today by creating post-click landing pages at scale while tracking your most important online advertising metrics. Sign up for an Instapage Enterprise demo today.

See the Instapage Enterprise Plan in Action.
Demo includes AdMap™, Personalization, AMP,
Global Blocks, heatmaps & more.
