At Instapage we talk about A/B testing a lot. And not just with post-click landing pages either. We test our post-click landing pages, Google Ads, Facebook ads, email messaging, etc.
Recently, we completed A/B testing our homepage to determine if variation B would perform better than our control (original) homepage based on certain objectives.
Why did we A/B test our homepage?
Homepage split testing may seem strange or even dangerous to some marketers because your homepage is like your digital storefront because online traffic sees it from organic search results, email messaging, event marketing promotions, social media posts — pretty much everything. Your homepage often helps form first impressions to the market about your brand, product, or service. Some marketers may even be hesitant to A/B test their homepage if it’s performing very well.
That was precisely the case for us.
Our homepage generated quite a bit of interest for us and free trial sign-ups every single day. But our team knew it could do better. So our product and marketing teams got together with the goal of telling the Instapage story more effectively while creating more engagement and even better results. Specifically, would the variation page generate more free trial signups while focusing on our target personas.
- Purpose: Educate our audience more effectively about the complete Instapage platform and the products we offer
- Goal: Increase free trial signups
- Total sessions: 76,000+
- Traffic split: 50/50
What was different between the two variations?
Starting from the top, let’s compare.
Headline secondary CTA button
Original (“Watch Video”)

Variation (“See How it Works”)

Granted, both highlighted CTA buttons above opened up the same Instapage demo video, but “Watch Video” is pretty vague and not as direct and specific as “See How it Works.” Essentially, it’s saying, “see how the Instapage post-click landing page platform can produce more ROI from your digital advertising spend.”
Customer logos
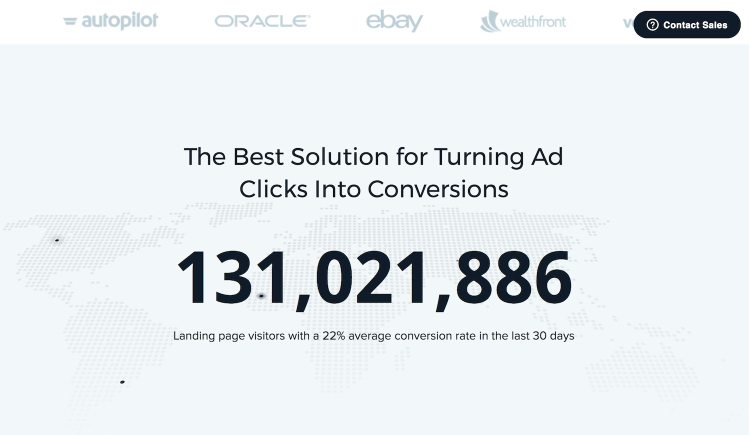
Directly underneath the headline and subheadline is a row of customer logos. Although different brand names, what is more noticeable is that the original contained a counter with post-click landing page visitors in the previous 30 days. Compare this to the variation where it includes a comparison of the industry average PPC conversion rate compared to Instapage customers’ post-click landing pages conversion rates.
Original
Variation
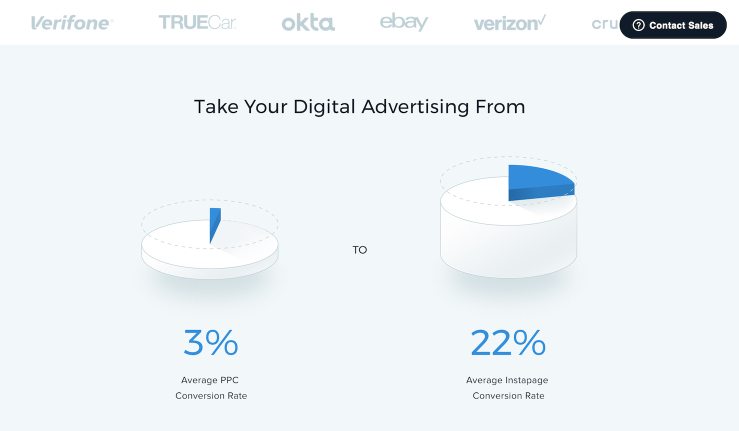
Changing this visual component enabled us to educate our audience on one of our true differentiators: beautiful, professionally-designed pages that convert much higher than industry averages instead of just showing the total amount of visitors with a fancy counter.
First features listed
Scrolling below the customer logos and we find the first few features that make Instapage the most powerful post-click optimization platform. You’ll notice the variation included blue-outlined CTA buttons specific to the feature, whereas the original homepage only showed hyperlinked text.
Original
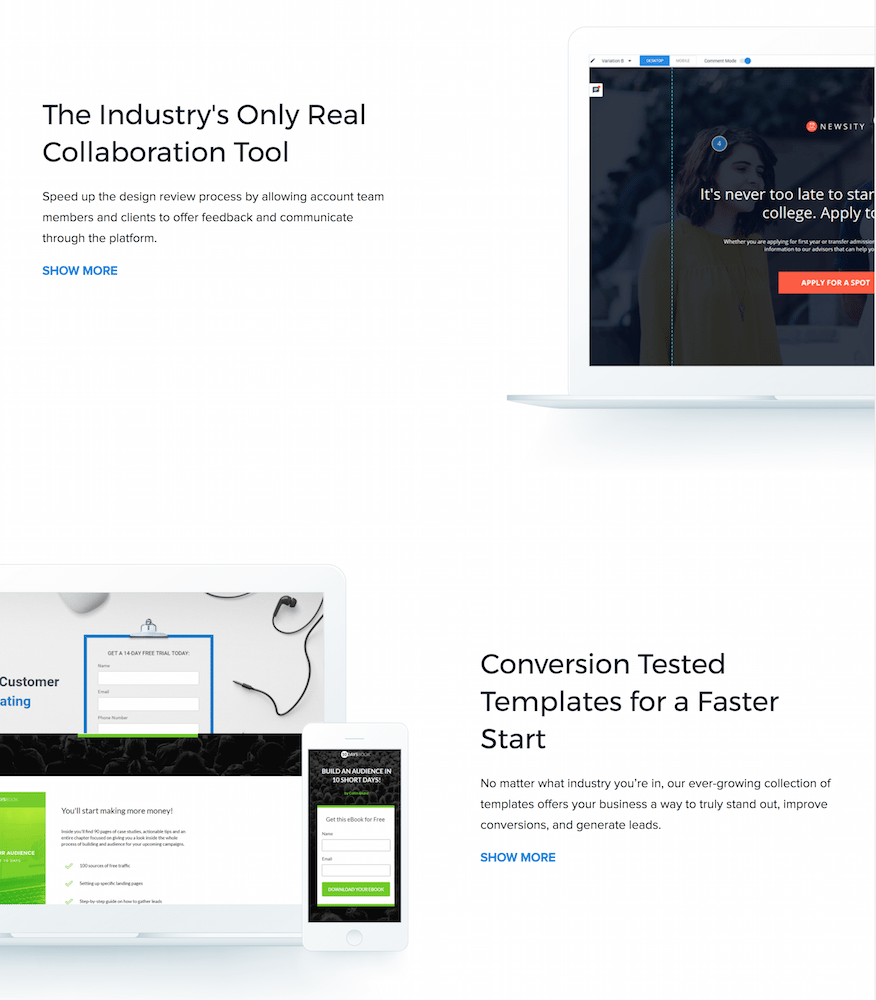
Variation
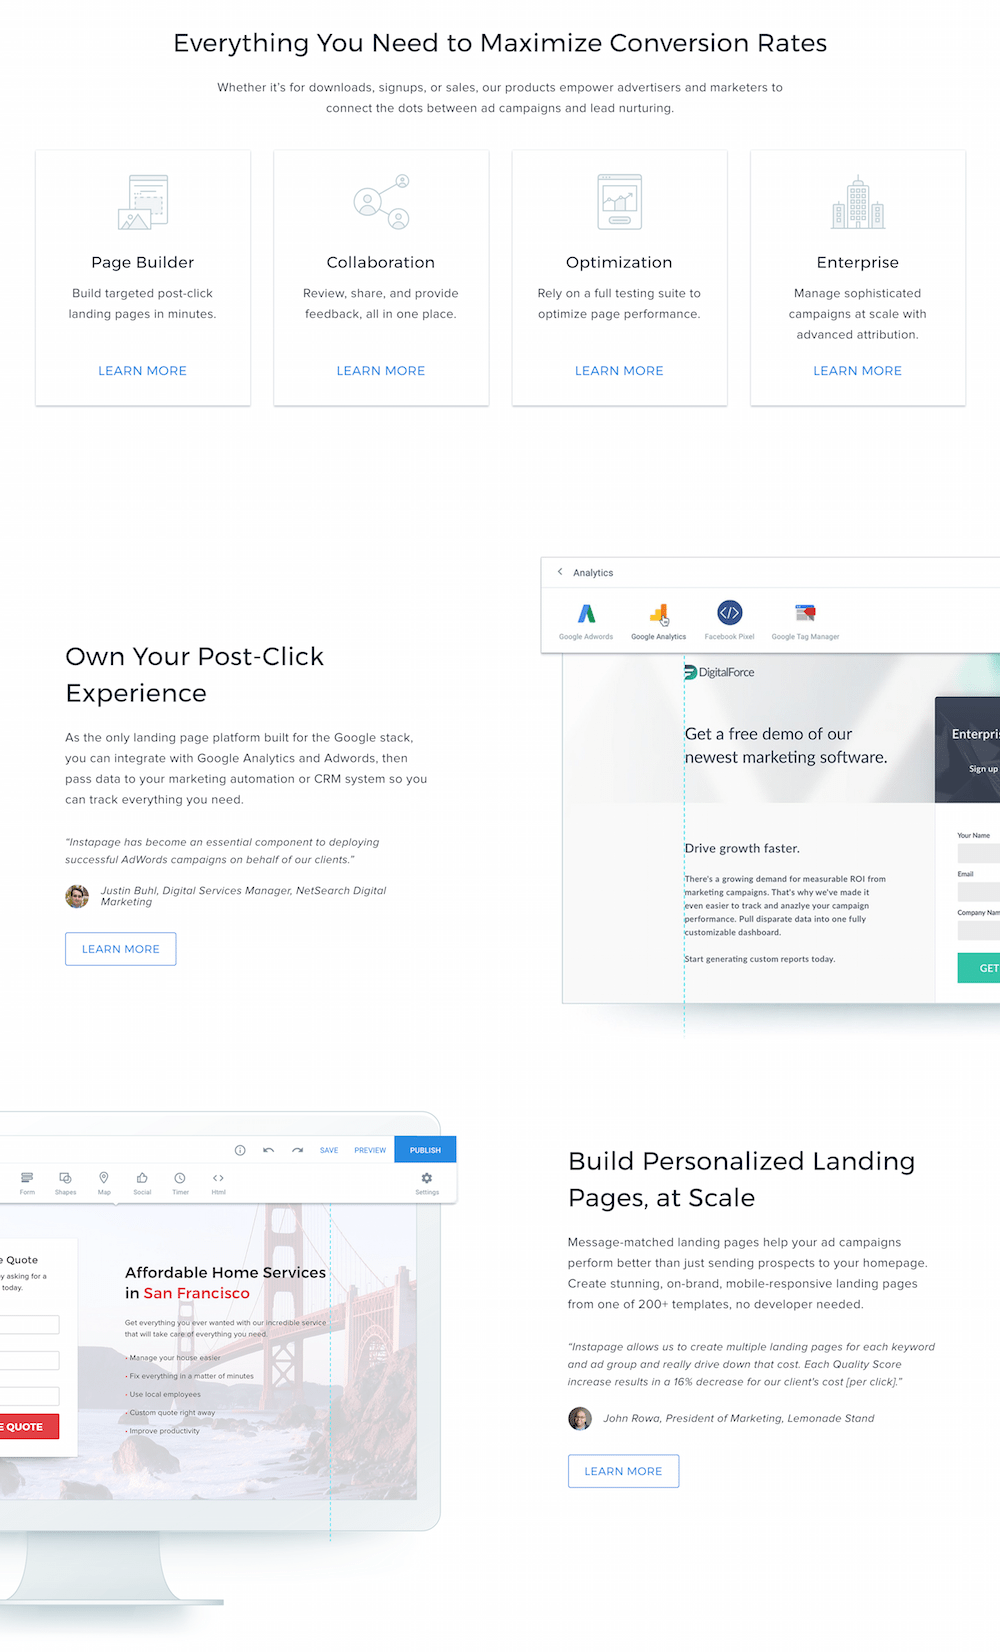
This section of the homepage variation continued the story better than the original. Since the headline and pie charts spoke about conversion rates and PPC, so did the four tiles, post-click landing page, and personalized pages at scale.
Testimonials
Another big visual change is how testimonial videos played.
Original
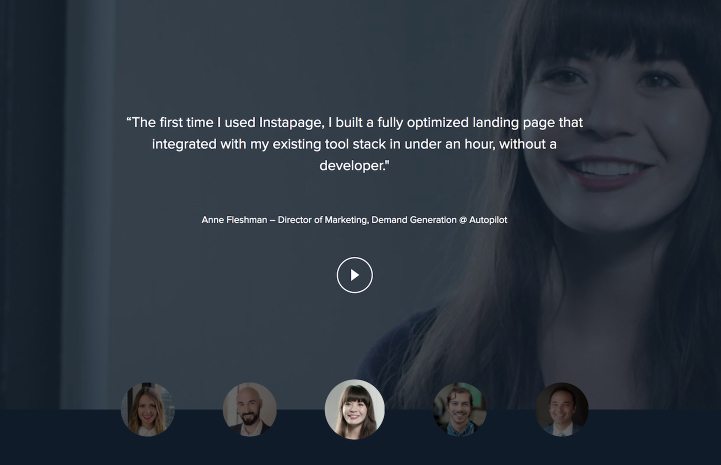
Variation
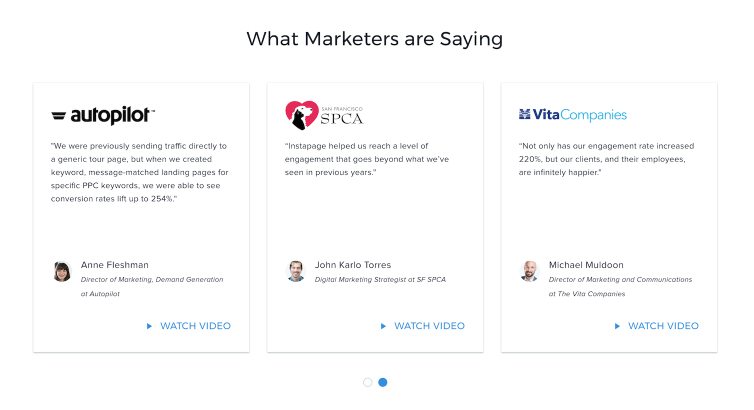
The main difference with this section is that the variation listed multiple testimonials in a slider format with company name, whereas the original only featured one testimonial at a time.
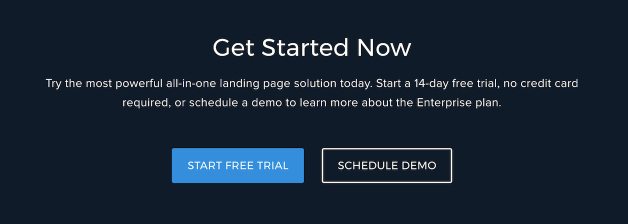
Closing header and CTA buttons
Once a visitor scrolled to the bottom, two different closing headers and CTA buttons were used. The first mentions the 14-day free trial outright with a link to the signup page. Compare that to the variation where the headline creates urgency (Get Started Now) with an additional CTA linked to the enterprise demo post-click landing page (“Schedule Demo”):
Original

Variation
The final data: Which version won?
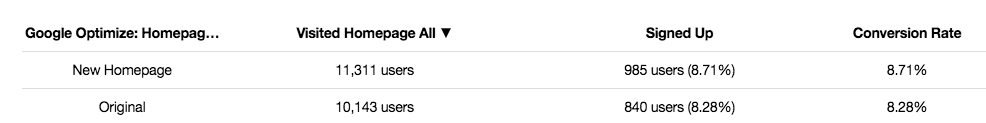
Total free trial signups
- Original: 840
- Variation: 985
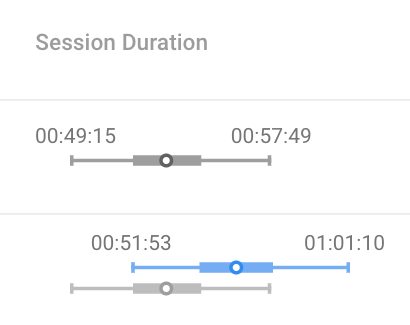
Google Optimize session duration
- Original (gray): 53:20
- Variation (blue): 56:19
Google Analytics bounce rate
- Original: 27.63%
- Variation: 7.11%
Google Analytics average time on page
- Original: 16:02 minutes
- Variation: 13:08 minutes
Google Analytics pageviews to product pages
Cumulative pageviews to all of our product pages (builder, optimization, collaboration, etc.) also increased during the test (red line below). This is significant because each product page is dedicated to that respective feature and helps sell the value of it in relation to the entire Instapage platform:
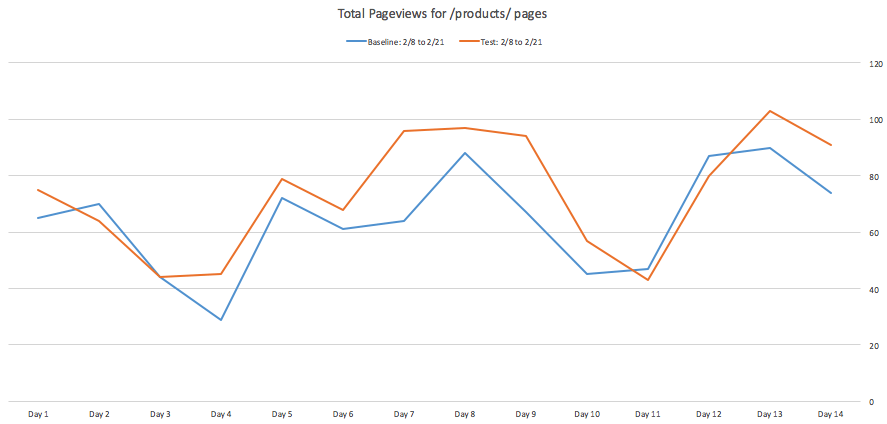
The more visitors that learn about how we optimize advertising spend coupled with our unique features, the more confident we are in generating new customers.
In summation, Google Analytics showed nearly a 3-minute drop in average time on page with the variation. Yet, all other metrics in our homepage A/B test favored the variation as the winner because we saw more free trial signups, a longer session duration, and significantly lower bounce rate.
Equally important is the fact that the variation improved our marketing messaging to focus on the right buyer personas while educating the market about the entire Instapage platform.
So if you visit our homepage you will see a brand new look!
What you can learn from our homepage A/B test
A/B test as much as you can, on a variety of platforms. Don’t just test paid ads or post-click landing pages — test everything. Make big changes so you can really see a difference in how people engage with your brand, not just small changes like a button color or a different headline.
A/B testing allows you to ascertain which post-click page is bringing in the most conversions. Learn how to provide 1:1 ad personalization for every audience you have with an Instapage Enterprise demo today.

See the Instapage Enterprise Plan in Action.
Demo includes AdMap™, Personalization, AMP,
Global Blocks, heatmaps & more.