
You already know that pay-per-click advertising (Google AdWords specifically) is filled with endless opportunity to generate more brand awareness, page views, and of course new sales. But optimizing your AdWords account isn’t just about bidding smartly, writing creative ad copy, adding extensions, and building negative keyword lists.
There is a lot more fine tuning you can do to target your audience, lower your cost per acquisition, and enjoy greater ROI.
One AdWords optimization technique often overlooked is the “Dimensions” tab. From new keywords, new display placements, and better performing post-click landing pages, there is a never ending list of tweaks and improvements to be found here.
As the CEO of KlientBoost, our team has enjoyed great success digging into our own AdWords account Dimensions tab, and helped numerous clients optimize their campaigns with Dimensions targeting as well. Today, I’ll break down a few areas where you can do the same.
What is the AdWords Dimensions tab?
The AdWords Dimensions tab breaks down your campaign’s performance into bite-sized chunks that are easy to understand so that you can lower your cost per conversion, increase your conversion rate, and increase your total conversions.
To access the Dimensions tab, click on the tab in your AdWords dashboard, which opens a drop-down menu with a list of different options:
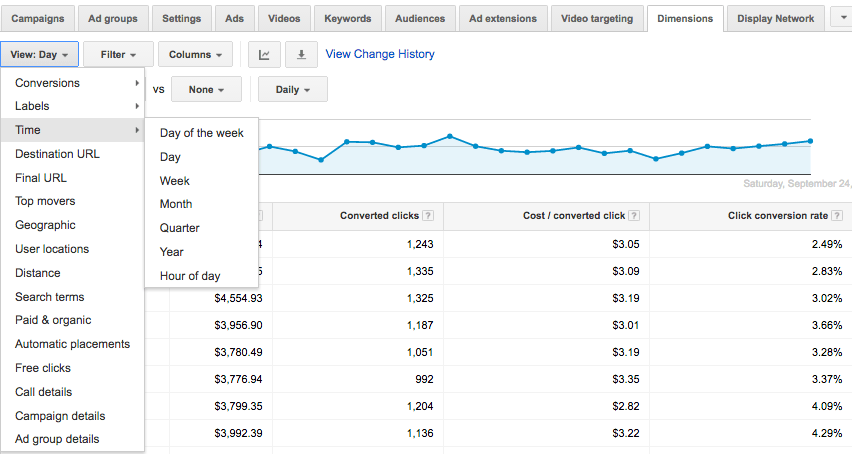
Once you’re in the Dimensions tab, you’ll notice the “View” drop-down, which contains specific dimensions that allow you to optimize your campaign a variety of ways. There are sixteen opportunities, of which I’ll speak about six of them today.
Opportunity #1: Time
If you’re not careful and neglect to optimize your campaigns regularly, you’ll end up spending more time and money than you’d like.
Fortunately, AdWords doesn’t require your time as much as your budget, but it can perform remarkably different during the days of the week and different times of the day.
As a savvy marketer and AdWords pro, you understand you can save money by not overpaying for conversions — when you look at the right data. That’s exactly what the Dimensions “Time” report will show you.
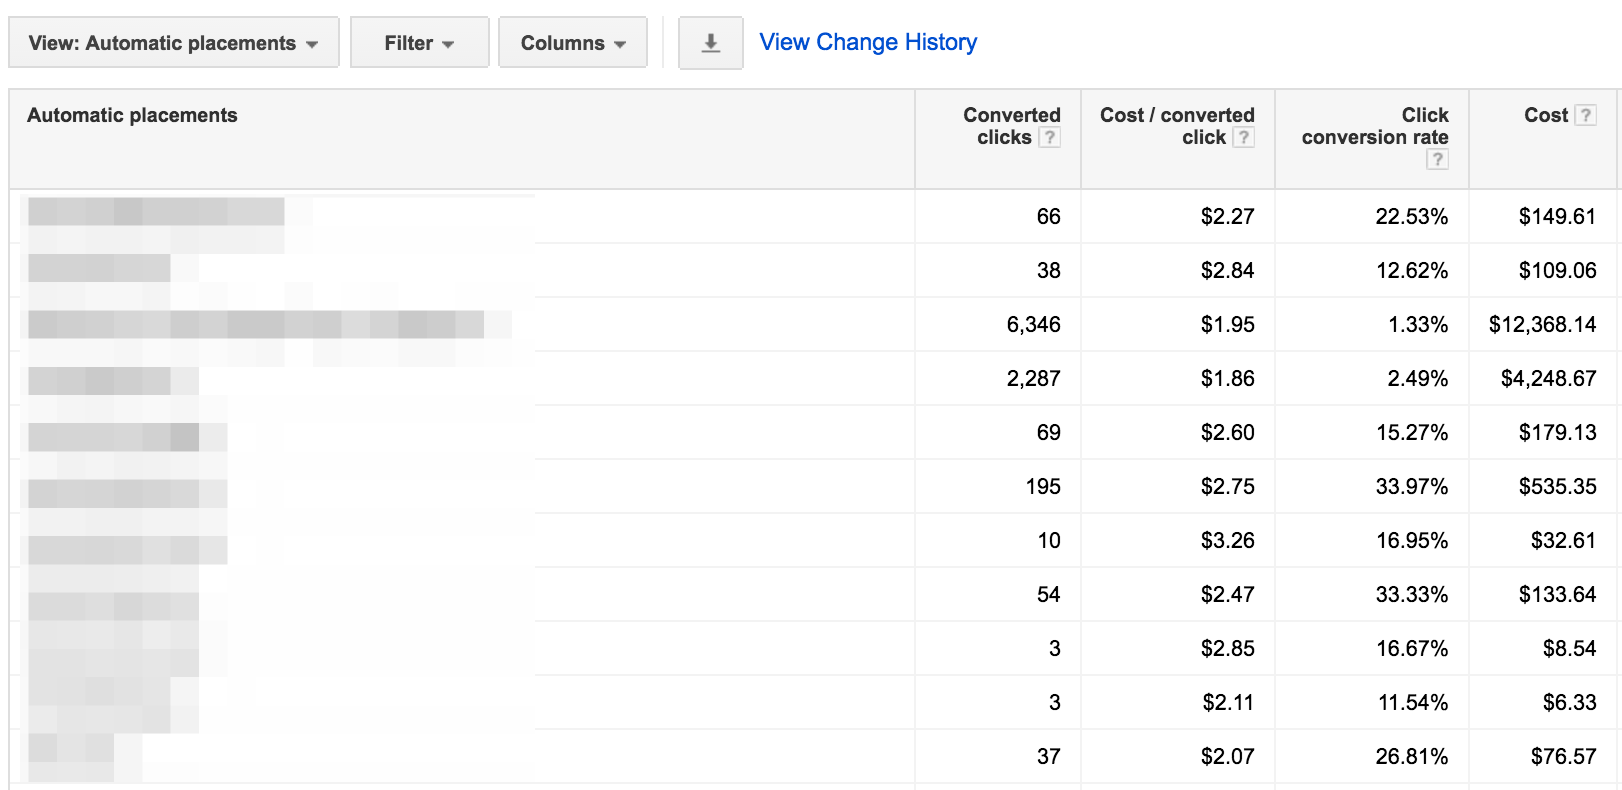
Below is a look at one of KlientBoost’s clients during a 30 day period. Looking at the data here, Tuesdays are the most expensive CPA day ($3.26):
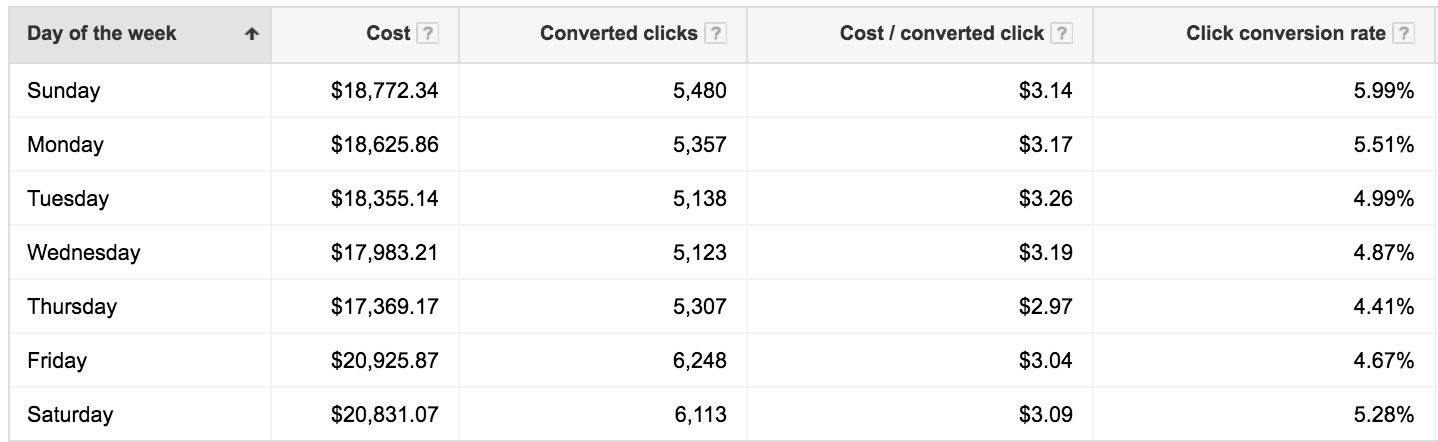
Now that you’ve identified which days are the cheapest and most expensive cost per conversion, you can add in bid adjustments to make sure you bid down on the high-cost days. Simultaneously, you can also increase bids on the low cost (low average position) days to take advantage of those low-cost conversions.
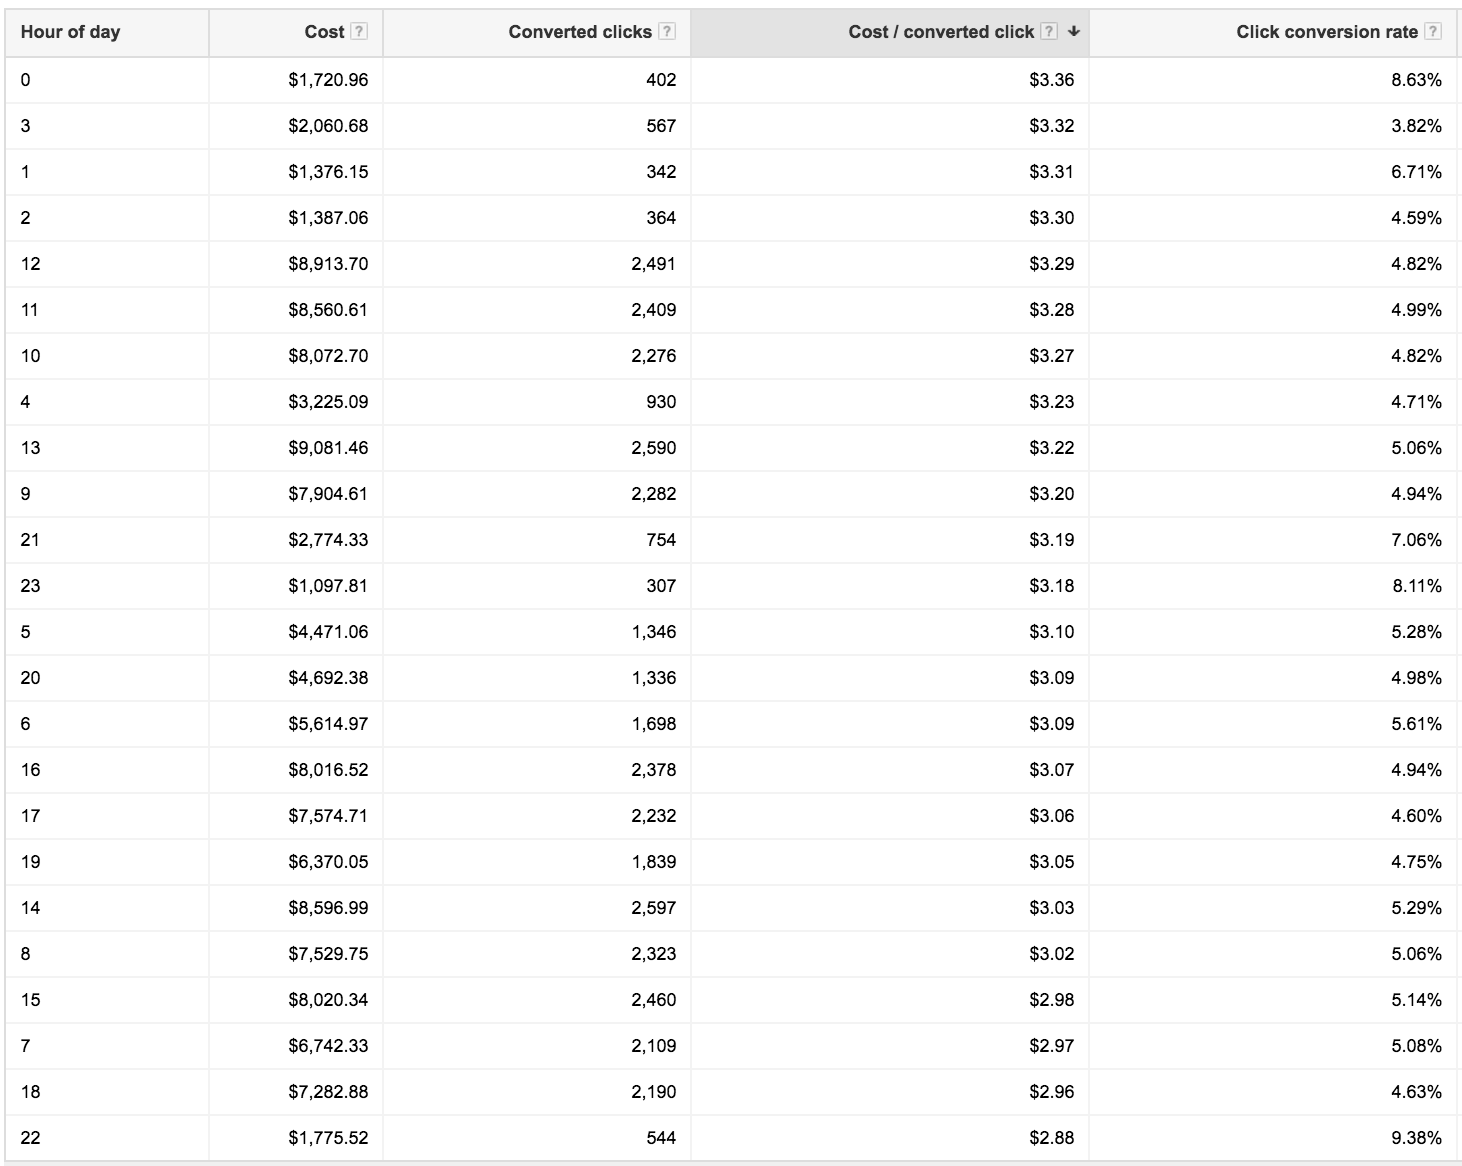
Taking it one step further, you can segment the times of day performing the best for you and do the same thing: Add in bid adjustments to decrease your average cost per conversion during the most expensive times, and vice versa.
Taking another look at the same client from above, we can see that the midnight to 1 am is the worst performing hour:
Opportunity #2: Final URLs
This report allows you to view multiple post-click landing page tests in a single view. Take a look at the Final URL report to see a breakdown of all the URLs that are currently generating traffic, including Final ad URLs and sitelink URLs:
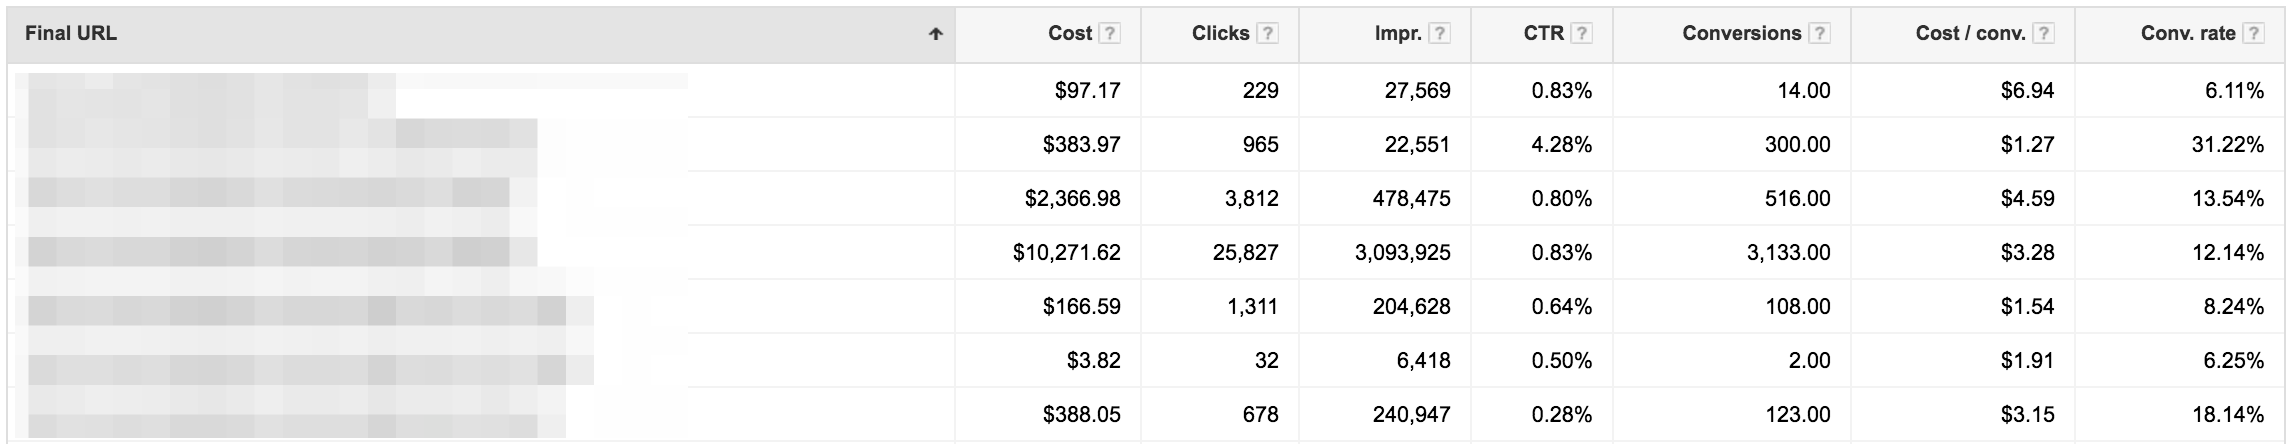
Once you’ve reviewed this report, you may be able to take advantage by doing two things:
Send more of your current traffic to the post-click landing page(s) that are performing the best (lowest CPA and highest conversion rate).
Expand the traffic selection of the keywords/placements that are currently going to the best performing post-click landing page to get more traffic and conversions.
Both of these tactics can significantly improve your campaigns, and your post-click landing page conversions will be better off because of it.
Opportunity #3: User locations
Interestingly enough, the Geographic report and User locations report are two different views, with an interesting twist.
The Geographic report indicates which cities, states, and regions are performing based on the geographic targeting that you’ve set at your campaign levels. You can break down the ad group’s individual performance at a geographic level, too.
In contrast, the User locations report shows a true view of where all your impressions and clicks are coming from and doesn’t consider your geographic campaign level targeting. Meaning, the Geographic report indicates the physical location and interest, while the User locations report only shows physical location.
So which report is better?
User locations and here’s why…
User locations doesn’t consider your current geographic targeting. Rather, it looks at the accurate view of where all your impressions are coming from. So even though you might be limiting your target area to the United States, your ads can (and will) show up in other countries, like our client learned:
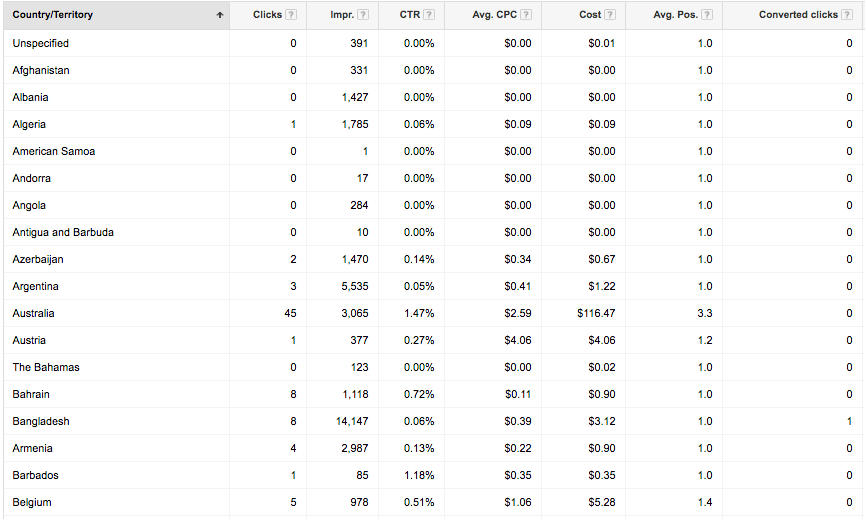
You’re not targeting Belgium, are you?
Even though there aren’t many clicks outside of your targeted areas, the damage these clicks can do to your overall click-through-rate is significant due to the inflated impressions.
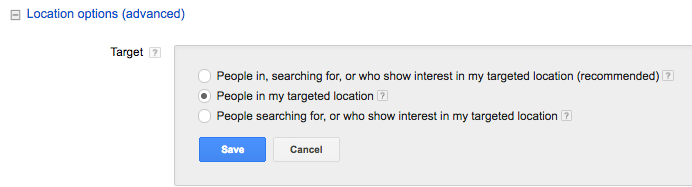
To ensure you don’t show up in outside areas that you’re not targeting, make sure your Location options (an advanced setting) is set to the middle radio button:
(It’s worth noting that the level of optimization you implement on the User Locations report is dependent on your business. For example, tourist oriented services will likely want their ads shown in foreign locations so these business types will not want to exclude geographic locations.)
Opportunity #4: Search terms
You’re likely using the Search terms report to add negative keywords based on what’s triggering your ads (and if you’re not, you should be). But you may be missing out on an even bigger opportunity.
Single Keyword Ad Groups (SKAGs) can help increase your click-through-rate, average positions, lower your cost-per-click, and your cost per conversions. The goal here is to see how often your search terms match your keywords and if there is a high discrepancy.
By sorting based on impressions in descending order, you can determine if one particular keyword might trigger 10+ search terms. If that’s the case, get more granular and turn those search terms into their own single keyword ad groups to control their bids. More importantly, you should be able to track what’s generating sales (not just conversions), if you’re in the lead gen or SaaS industry (because a conversion is a sale in the e-commerce world).
Opportunity #5: Paid & organic
(If you were ever concerned about your ads cannibalizing your free organic clicks, then this report is made for you.)
Many AdWords users have debated whether or not they should bid on their own brand terms, even if they already rank #1 organically. But you may also be ranking for other terms — in addition to your branded terms.
If your SEO efforts are paying off and you rank for generic and competitive terms, you may see your organic results and ads overlap on the SERP.
Once you link your Google Search Console to your AdWords account, you’ll be able to see the performance difference when your organic and paid results appear at the same time in the SERP, and what happens when they appear individually.
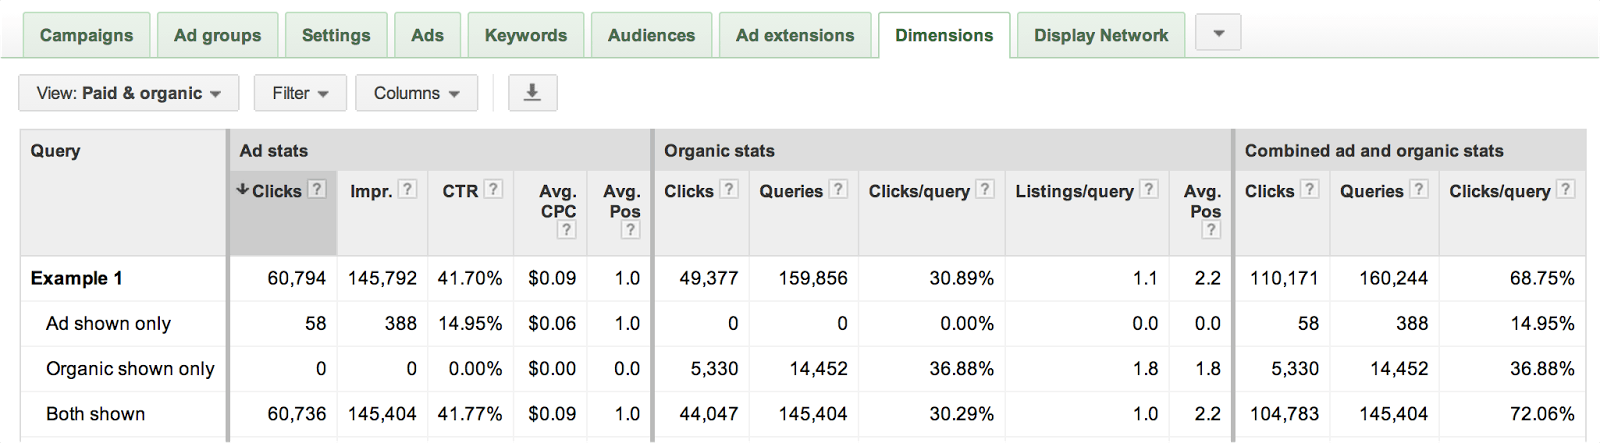
Below is an example how the report looks, breaking down each search term at a time. With the Paid & organic report, you can view the individual performance of organic and ad only, or with them both shown:
That’s great, but what should you do with this information?
If you’re worried about AdWords cannibalizing your organic results, try pausing and enabling keywords in your AdWords account and see how the Paid & Organic report changes performance on the organic side.
Be careful, though…
Your organic results can appear to global searchers while your AdWords results are shown in the geographic areas you target. Unfortunately, as of today, there is no breakdown available at the geo level that helps you make sure the data is more accurate, and therefore, more actionable.
On top of that, your organic traffic may not be as valuable (or valuable at all) if it originates from a geographic area that you can’t ship to or do business with, while the AdWords traffic will always be “business ready” since you control where your ads are being shown (that is, if you’re targeting the right locations via your User locations report).
Opportunity #6: Automatic placements
There’s a good chance that you’re running remarketing campaigns within AdWords and regular Display campaigns (and if you’re not, you should be). In particular, remarketing campaigns are a great strategy to implement because they allow you to target visitors who have previously engaged with your site or content. These external sites that display your ads are either targeted URL placements that you control or automatic URL placements that you don’t control — but are contextually targeted through your criteria.
One of the best reports within the AdWords Dimensions tab is the Automatic Placements report because it displays how each individual publisher site is performing.
For example, let’s imagine you’re running remarketing ads and generating a ton of impressions, clicks, and a healthy amount of conversions. What if you could target a high performing placement by itself and repeat that conversion success, again and again?
That’s exactly what this report breaks down:
Once you find placements that are performing well, you can extract them and create individual ad group placements to determine how that placement performs over time. What’s even better than that, is being able to control the specific bid around that one placement now that it’s targeted in its own ad group.
Your next steps
The AdWords Dimensions tab is one of the many PPC optimization treasures that you can find, and in my opinion, it’s one of the most valuable. From optimizing days and hours, geographies, search terms, placements and more; there’s a ton of insights you can use to build a stronger and healthier AdWords account that continues to perform over time.
Don’t ignore the post-click stage, provide every prospect with a personalized experience from start to finish. Sign up for an Instapage Enterprise Demo today.
About the author
Johnathan Dane is an international speaker and the founder of KlientBoost, a no-nonsense, creative, kick-ass AdWords and post-click landing page agency that hustles for results and ROI. If you liked this article, you should see what he’s writing on their company blog.
See the Instapage Enterprise Plan in Action.
Demo includes AdMap™, Personalization, AMP,
Global Blocks, heatmaps & more.